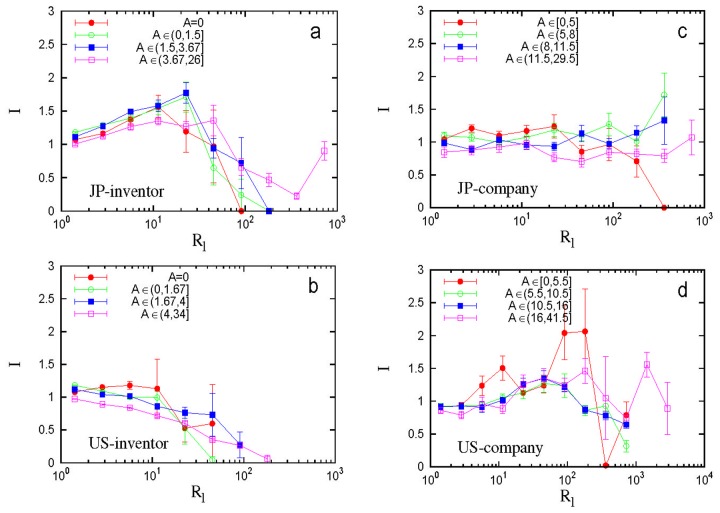
Fig 5. Effect of repeat collaboration on innovation performance of teams with similar team age.
(a, b) Inventors. (c, d) Companies. To separate the aging effect of a team from that of repeat collaboration among its teammates, we grouped patents according to the quartiles of their team age (A). The A-range of each group is shown in the legend. For each A-group we further grouped patents according to their repeat collaboration number (R l) and then calculated the average patent impact for each R l-subgroup.

