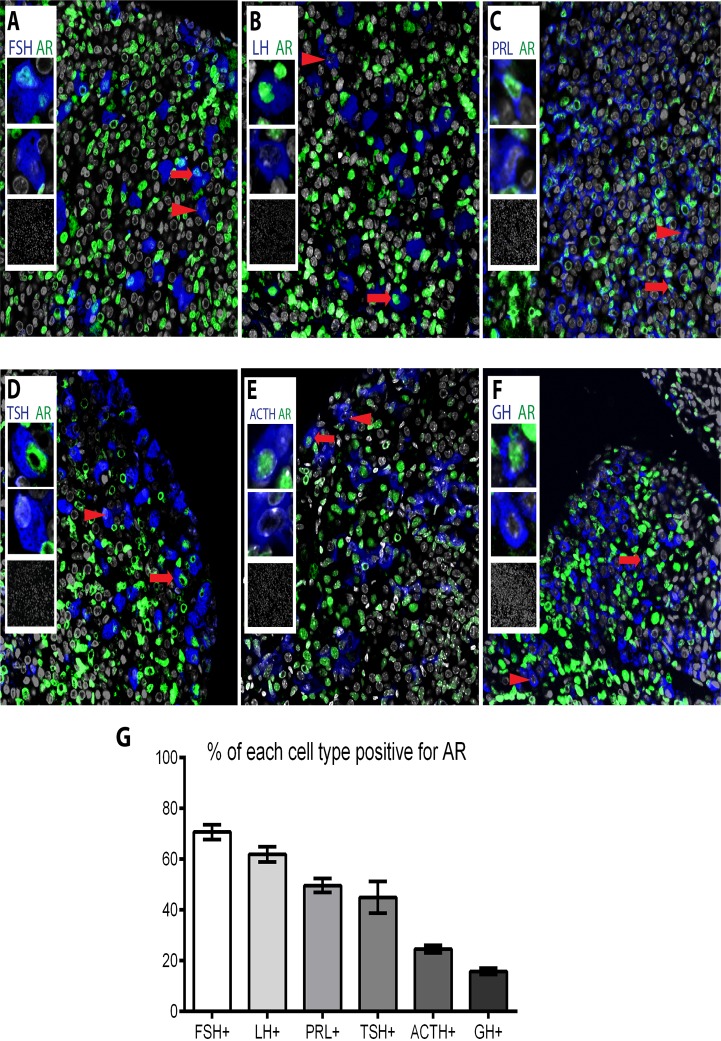
Fig 2. All pituitary endocrine cell populations express AR at different percentages.
Subpopulations of (A) FSH-positive gonadotrophs (blue), (B) LH-positive gonadotrophs (blue), (C) PRL-positive lactotrophs (blue), (D) TSH-positive thyrotrophs (E) ACTH-positive corticotrophs (F) GH-positive somatotrophs stain positive for AR (green). Arrows point to AR positive cells and arrowheads to AR negative cells, insets show magnifications of AR positive and negative cells, and no-primary controls. (G) When quantified, the percentage of each endocrine cell population positive for AR was 70.7% ±2.9 for FSH-positive gonadotrophs, 61.9% ±3.0 for LH-positive gonadotrophs, 49.65% ±2.78 for PRL-positive lactotrophs, 44.97% ±6.28 for TSH-positive thyrotrophs, 24.56% ±1.52 for ACTH-positive corticotrophs and 15.77% ±1.27 for GH-positive somatotrophs.

