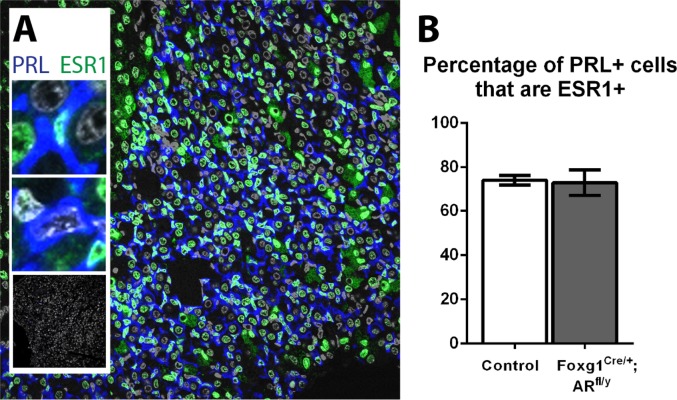
Fig 8. The percentage of lactotrophs expressing ESR1 does not change in Foxg1Cre/+; ARfl/y mice.
(A) A subpopulation of PRL-positive lactotrophs (blue) stain positive for ESR1 (green). Insets show magnifications of ESR1 positive and negative cells, and no-primary controls. (B) No significant difference was found in the percentage of lactotrophs that express ESR1 (Control 74.2% ±2.2, Foxg1Cre/+; ARfl/y 73.1% ± 5.8).

