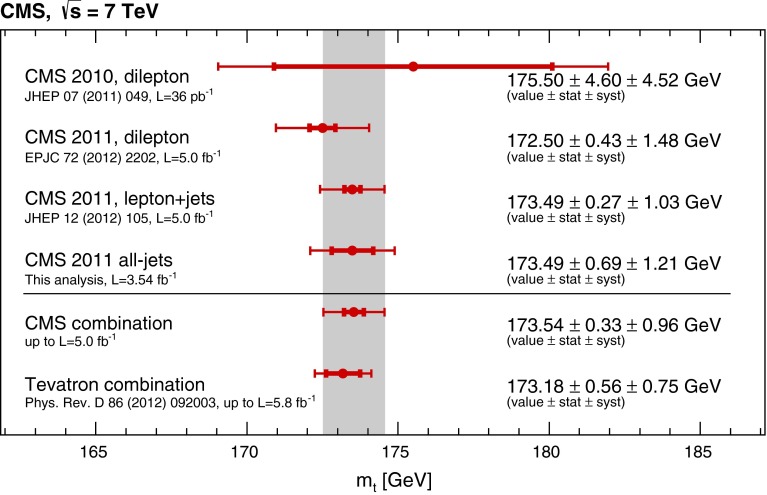
Fig. 5.
Overview of the CMS top-quark mass measurements, their combination that is also shown as the shaded band, and the Tevatron average. The inner error bars indicate the statistical uncertainty, the outer error bars indicate the total uncertainty. The statistical uncertainty in the in situ fit for the JES is treated as a systematic uncertainty

