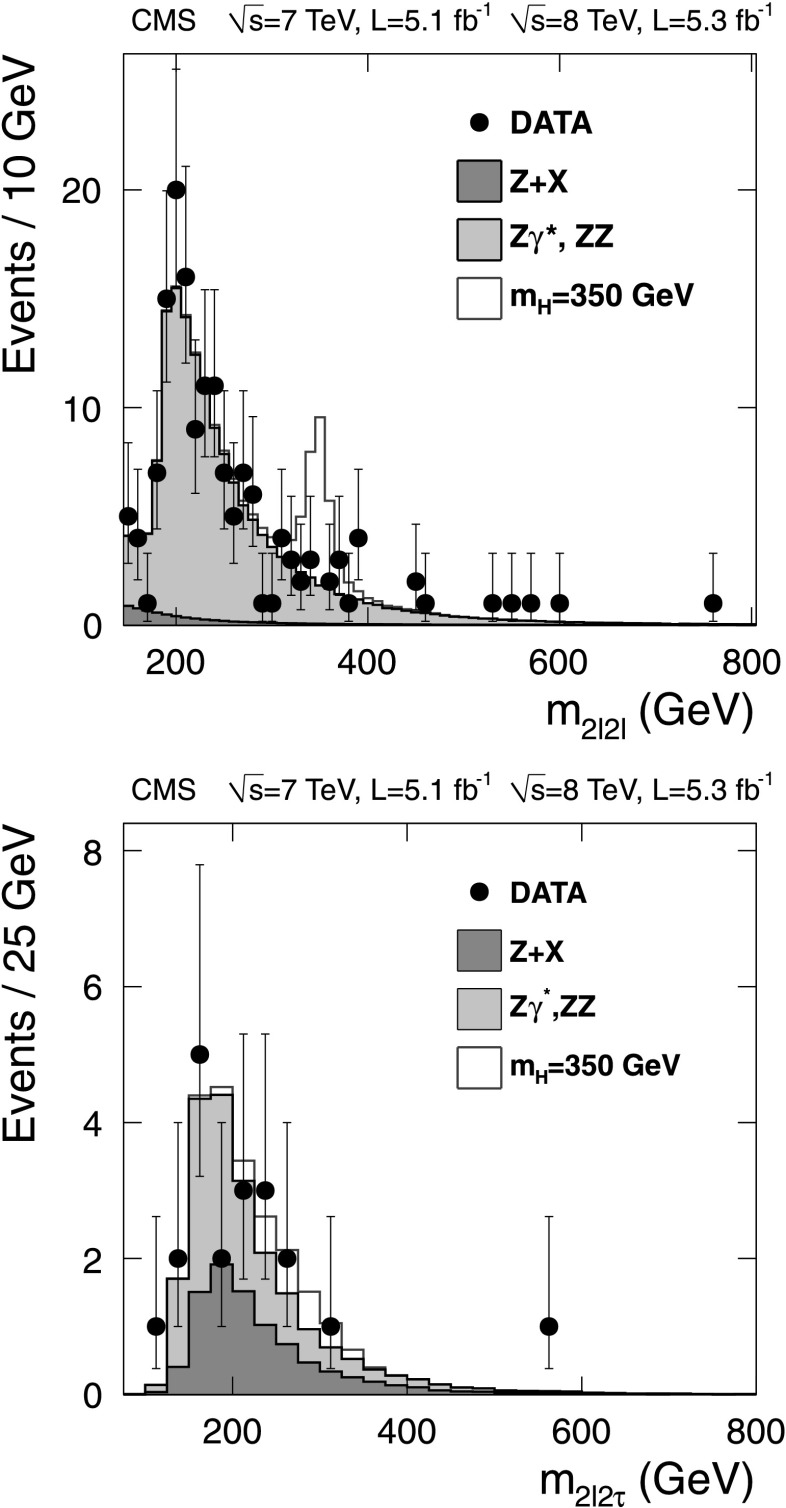
Fig. 5.
Distribution of the four-lepton reconstructed mass for (top) the sum of the 4e, 4μ, and 2e2μ channels, and for (bottom) the sum over all 2ℓ2τ channels. Points represent the data, shaded histograms represent the background, and unshaded histogram the signal expectations. The reconstructed masses in 2ℓ2τ states are shifted downwards with respect to the true masses by about 30 % due to the undetected neutrinos in τ decays

