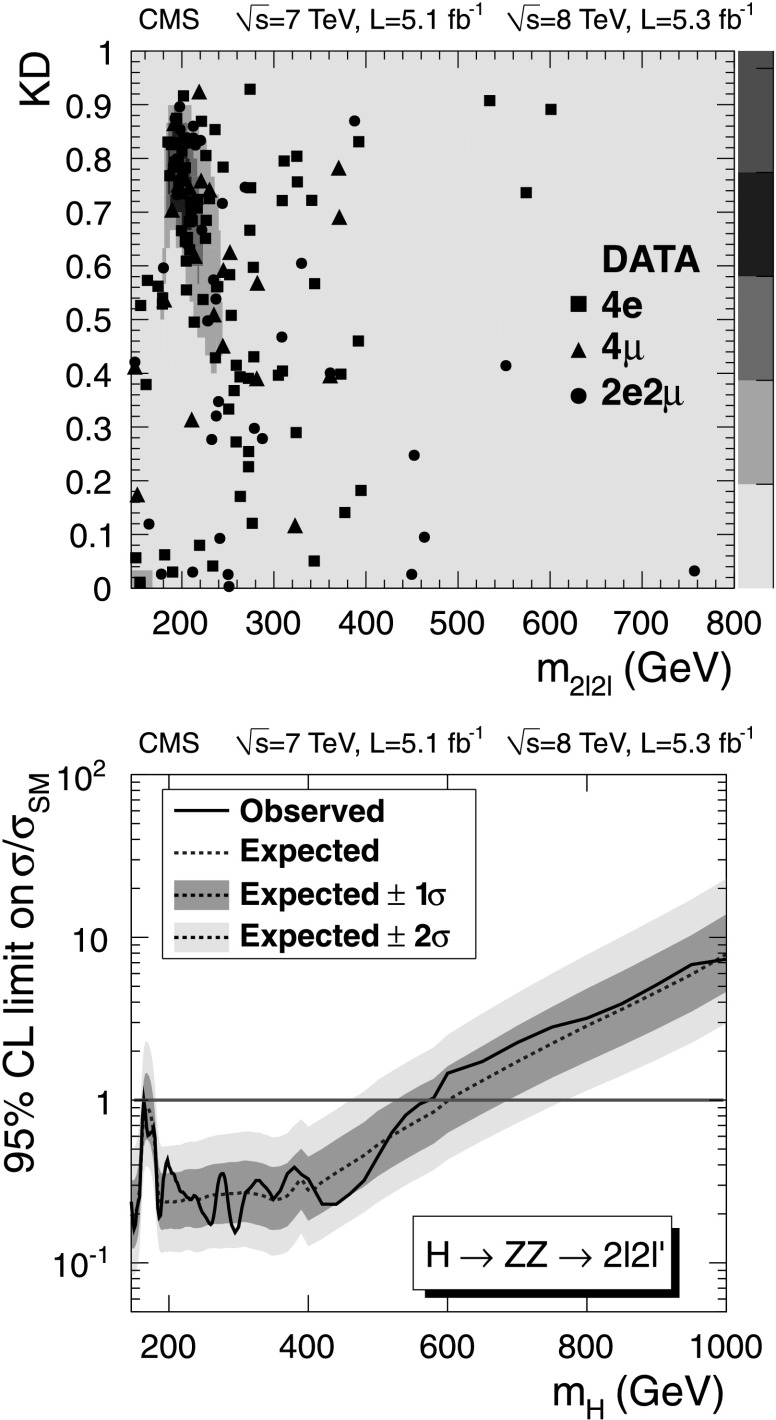
Fig. 6.
(Top) The distribution of events selected in the 2ℓ2ℓ subchannels for the kinematic discriminant, KD, versus m 2ℓ2ℓ. Events in the three final states are marked by filled symbols (defined in the legend). The colored contours (with the measure on the color scale of the right axis) represent the expected relative density of background events. (Bottom) Observed (solid line) and expected (dashed line) 95 % CL upper limits on the ratio of the product of the production cross section and branching fraction to the SM expectation in the H→ZZ→2ℓ2ℓ′ channel. The 68 % (1σ) and 95 % (2σ) ranges of expectation for the background-only model are also shown with green and yellow bands, respectively (Color figure online)

