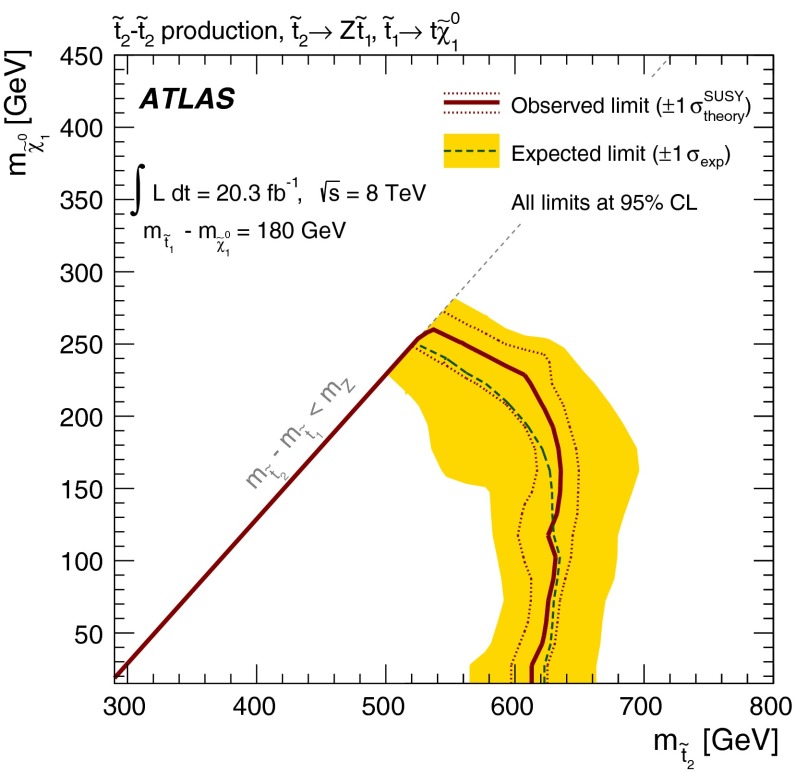
Fig. 4.
Expected and observed exclusion limits in the - plane for the direct pair production simplified model with . The contours of the band around the expected limit are the 1 results, including all uncertainties except theoretical uncertainties on the signal cross section. The dotted lines around the observed limit illustrate the change in the observed limit as the nominal signal cross section is scaled up and down by the theoretical uncertainty. All limits are computed at 95 % CL

