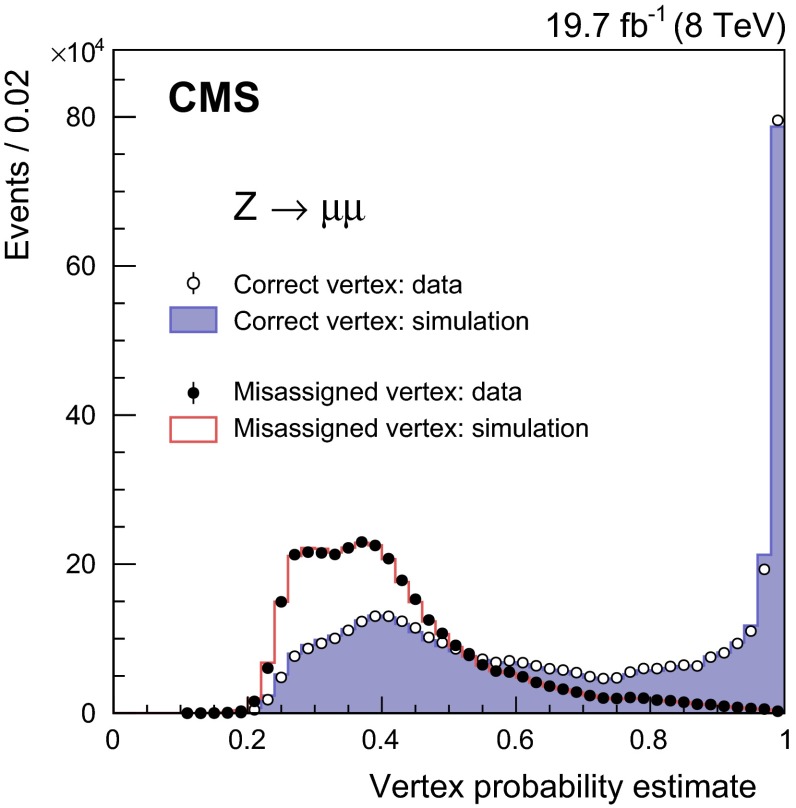
Fig. 5.
Distribution of the vertex probability estimate in events. The vertex probability estimates in 8data (points), are compared to the estimates in MC simulation (histograms). The comparison is made separately for events in which the vertex is assigned to the same (open circles and filled histogram), or to a different vertex (filled circles and outlined histogram), as that identified by the muons

