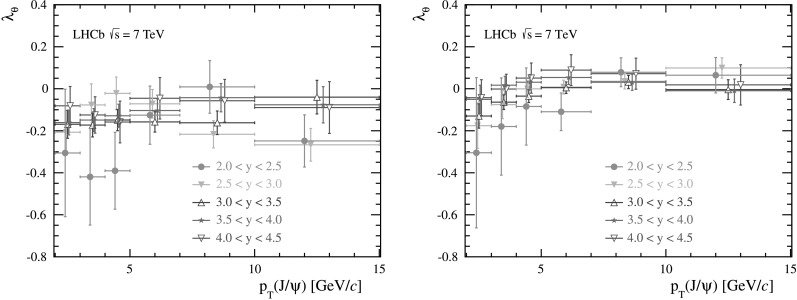
Fig. 4.

Measurements of λ θ in bins of p T for five rapidity bins in (left) the helicity frame and (right) the Collins–Soper frame. The error bars represent the statistical and systematic uncertainties added in quadrature. The data points are shifted slightly horizontally for different rapidities to improve visibility
