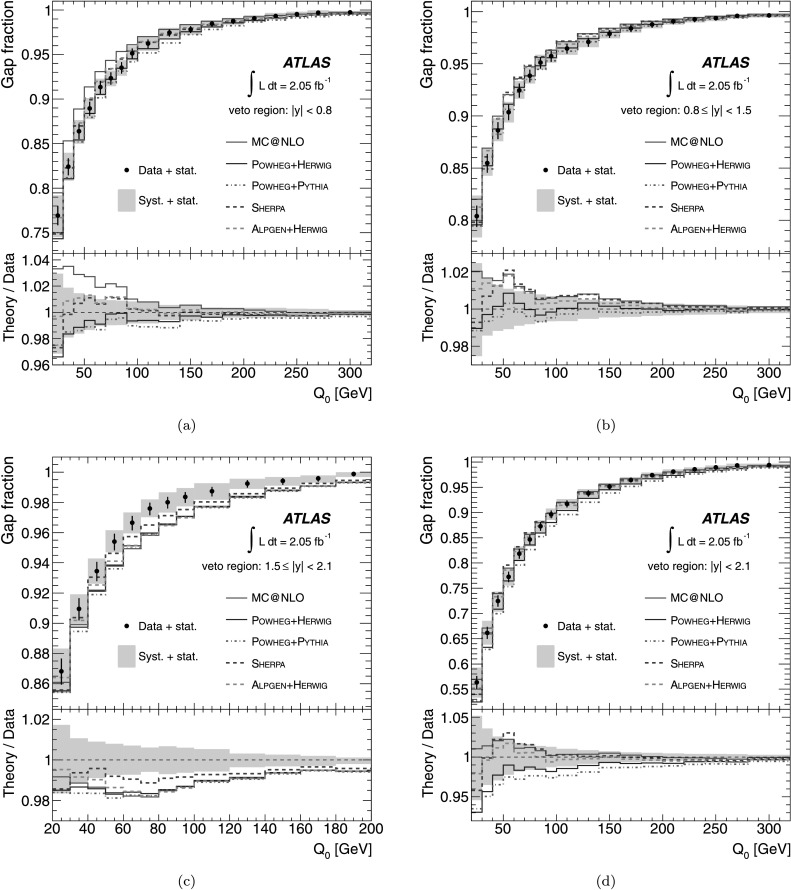
Fig. 4.

The measured gap fraction as a function of Q 0 is compared with the prediction from the NLO and multi-leg LO MC generators in the three rapidity regions, (a) |y|<0.8, (b) 0.8≤|y|<1.5 and (c) 1.5≤|y|<2.1. Also shown, (d), is the gap fraction for the full rapidity range |y|<2.1. The data is represented as closed (black) circles with statistical uncertainties. The yellow band is the total experimental uncertainty on the data (statistical and systematic). The theoretical predictions are shown as solid and dashed coloured lines. The gap fraction is shown until Q 0=300 GeV or until the gap fraction reaches one if that occurs before Q 0=300 GeV (Color figure online)
