
Figure 8.
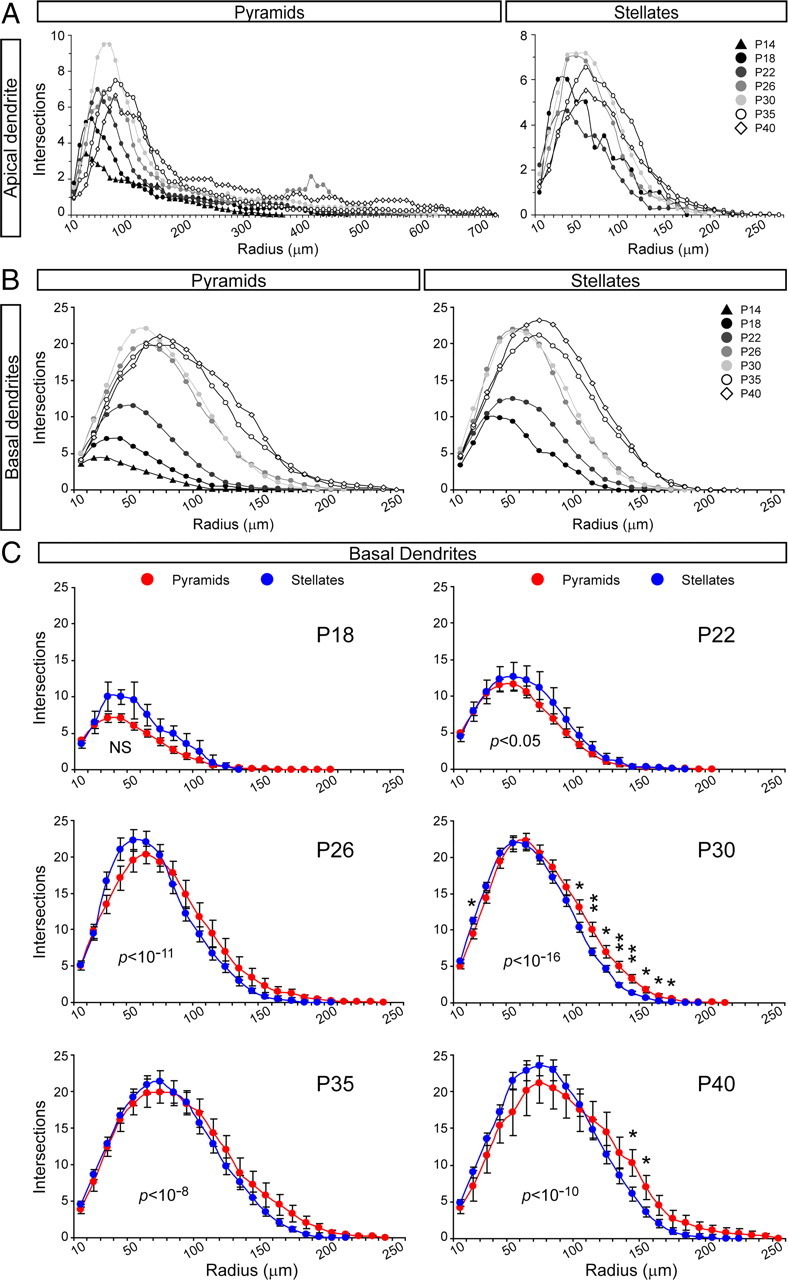
Comparison of complexity of apical and basal dendritic arbors of spiny layer 4 neurons in ferret A17 across normal postnatal development by Sholl analysis. A, B, Comparison of apical dendrites (A) and basal dendrites (B) of pyramidal and stellate neurons across the indicated developmental period. For clarity, mean values are plotted without SEM. Data are color coded for the different ages as indicated in legends. The data distributions were compared by Kolmogorov–Smirnov two-sample test: for apical dendrite pyramids, all comparisons were statistically different (p < 0.0001); for apical dendrite stellates, all comparisons were statistically different (p < 0.01) except for P18 compared with P22, P26, and P30, for P26 compared with P30, and for P35 compared with P40 (p > 0.05); for basal dendrite pyramids, all comparisons were statistically different (p < 0.0001) except for P26 compared with P30 and for P35 compared with P40 (p > 0.05); for basal dendrite stellates, all comparisons were statistically different (p < 0.05) except for P18 compared with P22, for P26 compared with P30, and for P35 compared with P40 (p > 0.05). C, Comparison of basal dendrites between pyramidal and stellate neurons at each individual age across the developmental period studied. Data points are mean ± SEM. *p < 0.05, **p < 0.01, t test after Kolmogorov–Smirnov two-sample test for differences in data distribution. In C, p values for Kolmogorov–Smirnov test at each age are indicated within the plot area. NS, Not significant, p > 0.05.