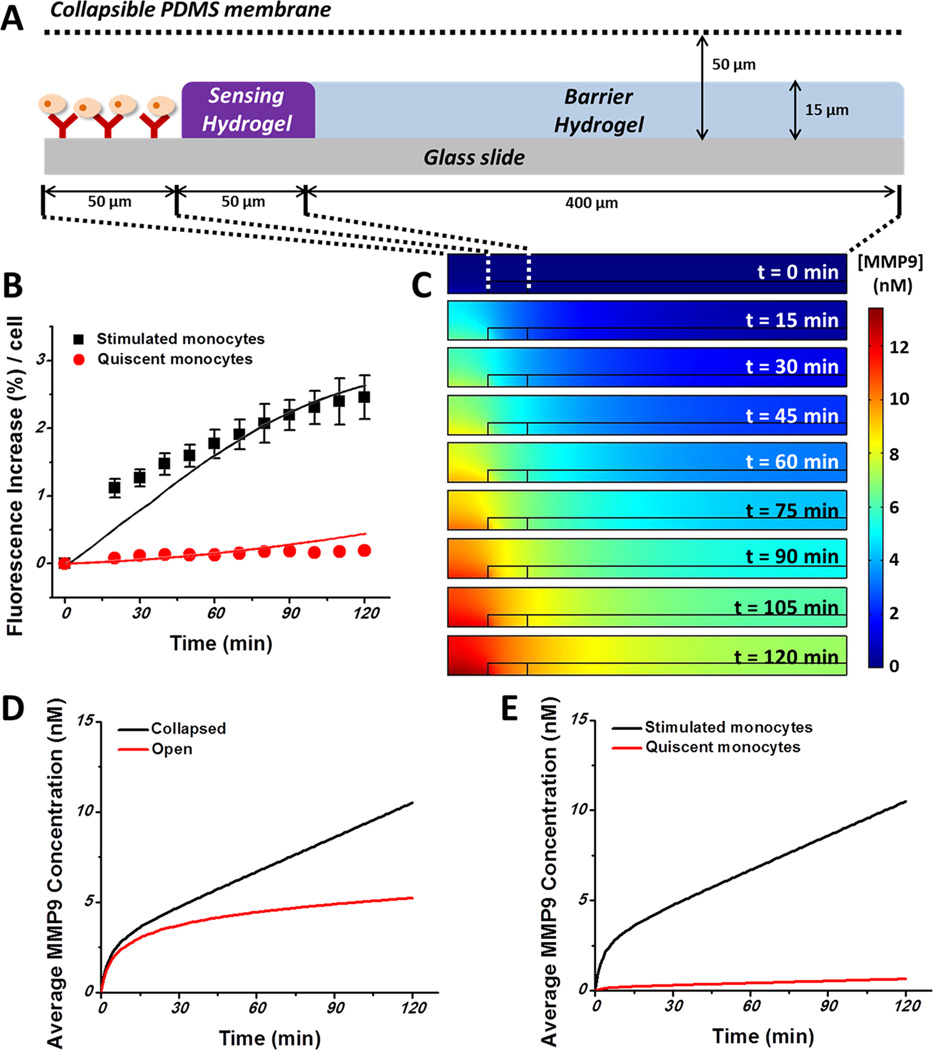
Figure 6.
Numerical simulation of MMP9 release and diffusion over time based on the diffusion reaction modeling. (A) 2D cylindrical coordinates of a sensing element with the origin at the center of the Ab-modified region. (B) Comparison of simulation results (solid lines) with experimental data (symbols) showing changes in fluorescence increase over time for stimulated/quiescent cells. RMS deviations: 7.19% for activated cells and 0.46% for quiescent cells. (C) Simulation results showing the MMP9 concentration profile over time. MMP9s are secreted by lymphoma cells located at the center and diffused to the sensing hydrogel. (D, E) Changes in average MMP9 concentration inside the sensing hydrogel matrix: (D) collapsed devices vs open devices; (E) stimulated cells vs quiescent cells.

