Figure 5.
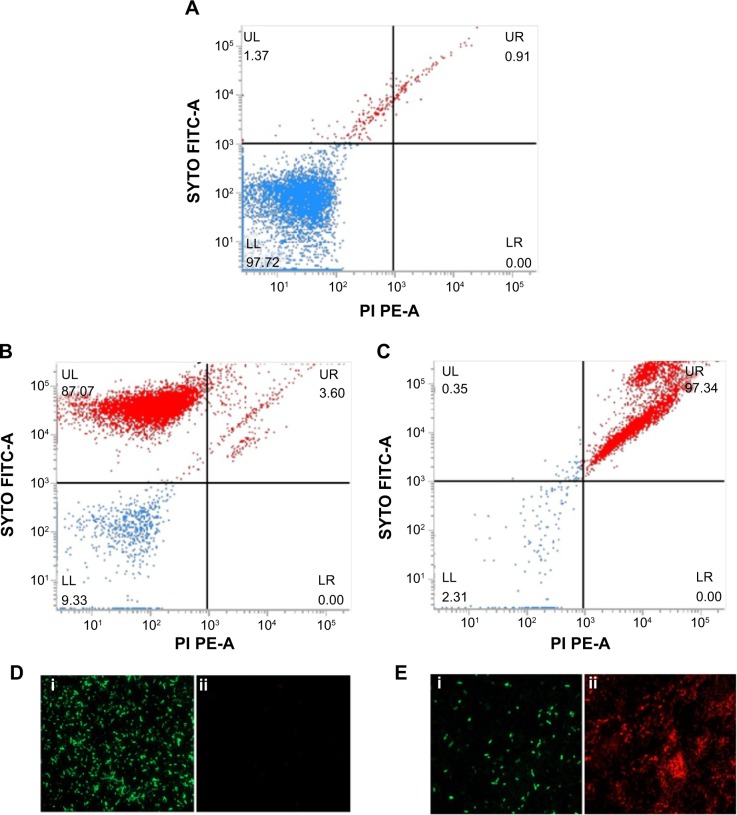
Live/Dead staining of planktonic Pseudomonas aeruginosa PAO1 cells by flow cytometer and FM.
Notes: Flow cytometer scatter plot for (A) untreated and unstained P. aeruginosa cells, (B) untreated SYTO9/PI stained, and (C) PBSNPs MIC-treated P. aeruginosa PAO1 cells stained with SYTO9/PI stains was analyzed; LL shows the unstained cells, UL region represents live cells, and dead cells are seen in the UR region. FM of cells prepared (D) untreated stained cells and (E) PBSNPs MIC-treated stained cells (i) represents live cells stained as green, (ii) dead cells stained as red.
Abbreviations: FITC, fluorescein isothiocyanate; PE, phycoerythrin; FM, fluorescence microscopy; PBSNPs, polymyxin B-capped silver nanoparticles; MIC, minimum inhibitory concentration; LL, lower left; LR, lower right; PI, propidium iodide; UL, upper left; UR, upper right.

