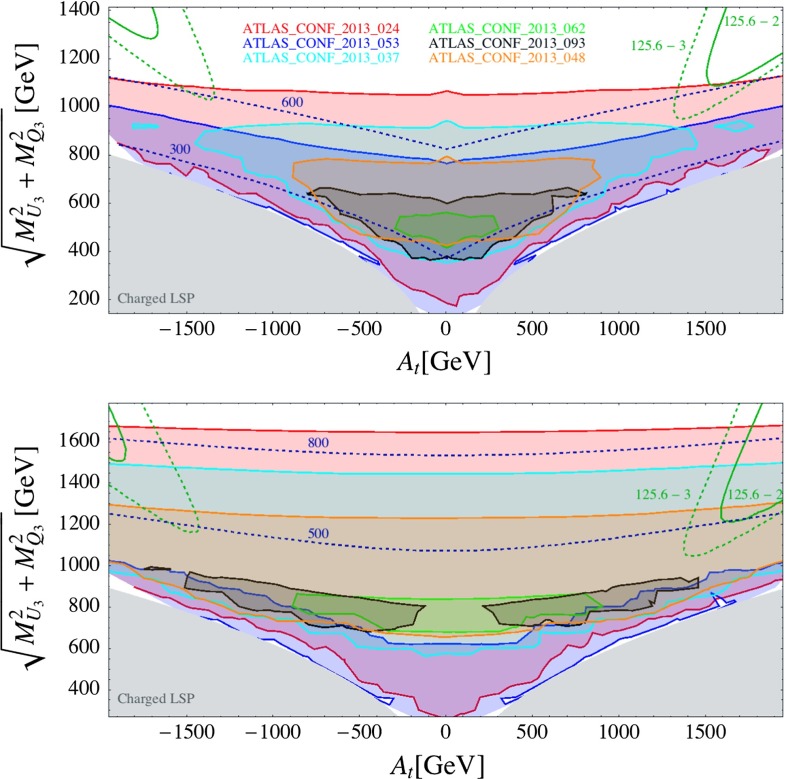
Fig. 13.
Constraints from direct SUSY searches on the (, ) plane. The upper plot we choose and in the lower one . The other parameters are GeV, GeV. Both plots show the exclusion regions from the analyses listed in the upper plot. The blue dashed curves show the mass contours. The green curves represent the Higgs mass contours, where we allow 3 (dashed) and 2 (solid) GeV deviation from the central observed value 125.6 GeV

