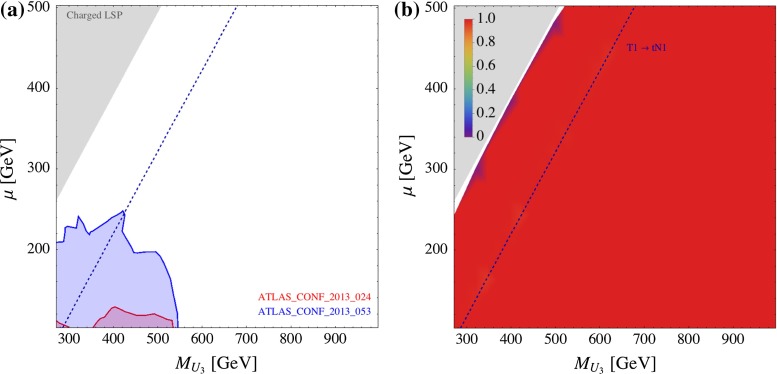
Fig. 8.
Constraints from direct SUSY searches on the (, ) plane. The other parameters are GeV, and . The left plot shows the exclusion regions from the analyses listed in the plot. The right plot shows the cross section coverage, as defined in Eq. (6). The blue dashed line represents the kinematical threshold of the decay

