
Fig. 12.
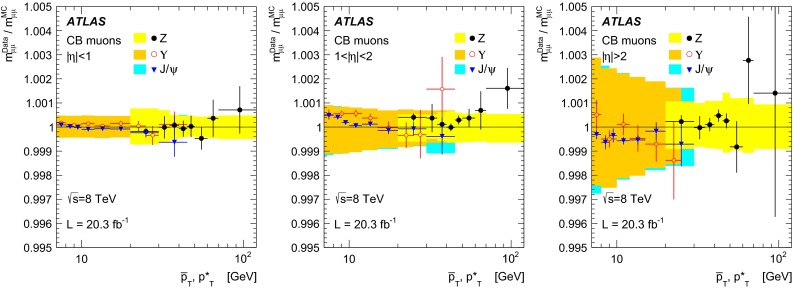
Ratio of the fitted mean mass, , for data and corrected MC from , and events as a function of the average transverse momentum in three ranges. Both muons are required to be in the same range. The and data are shown as a function of the while for data are plotted as a function of as defined in Eq. (16). The error bars represent the statistical uncertainty and the systematic uncertainty on the fit added in quadrature. The bands show the uncertainty on the MC corrections calculated separately for the three samples