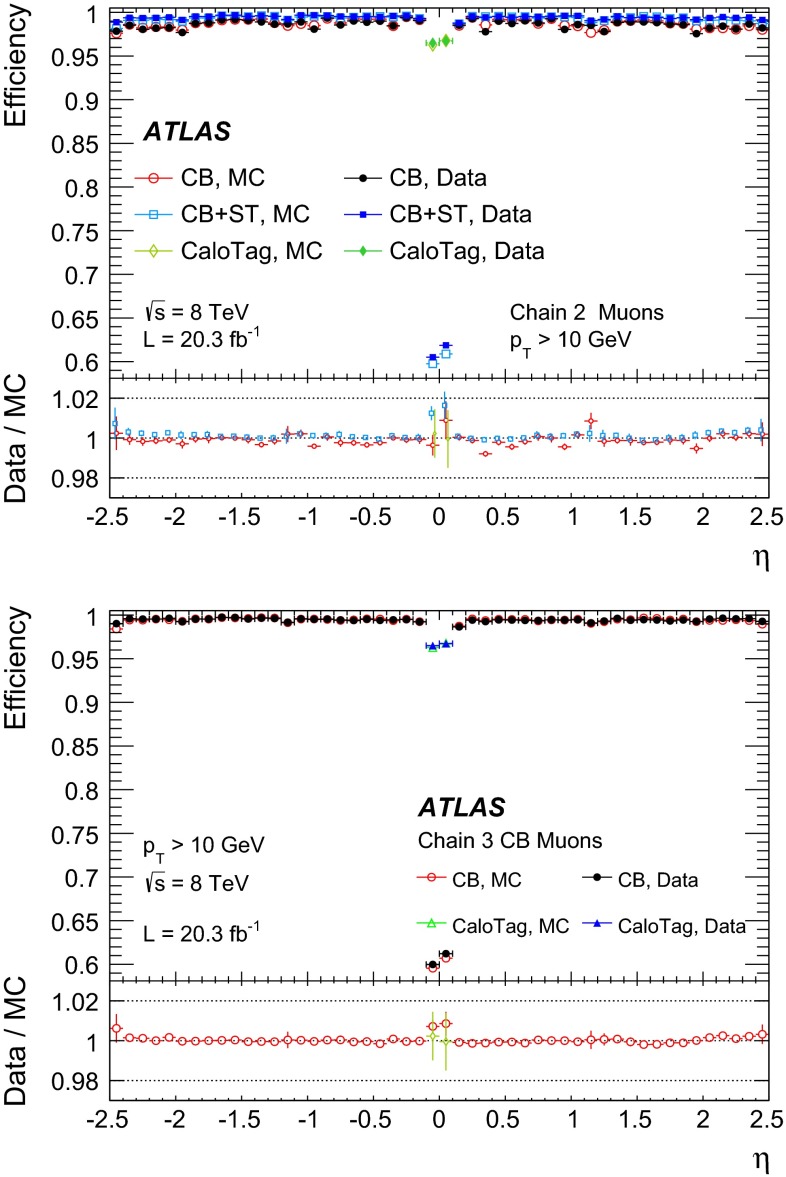
Fig. 18.
Muon reconstruction efficiency as a function of , measured using events, for muons reconstructed with Chain-2 (top) and Chain-3 (bottom), for different muon reconstruction types. CaloTag muons are shown in the region , where they are used in physics analyses. The error bars shown for the efficiencies represent the statistical uncertainty. The panel at the bottom shows the ratio between the measured and predicted efficiencies. The error bars show statistical and systematic uncertainties added in quadrature

