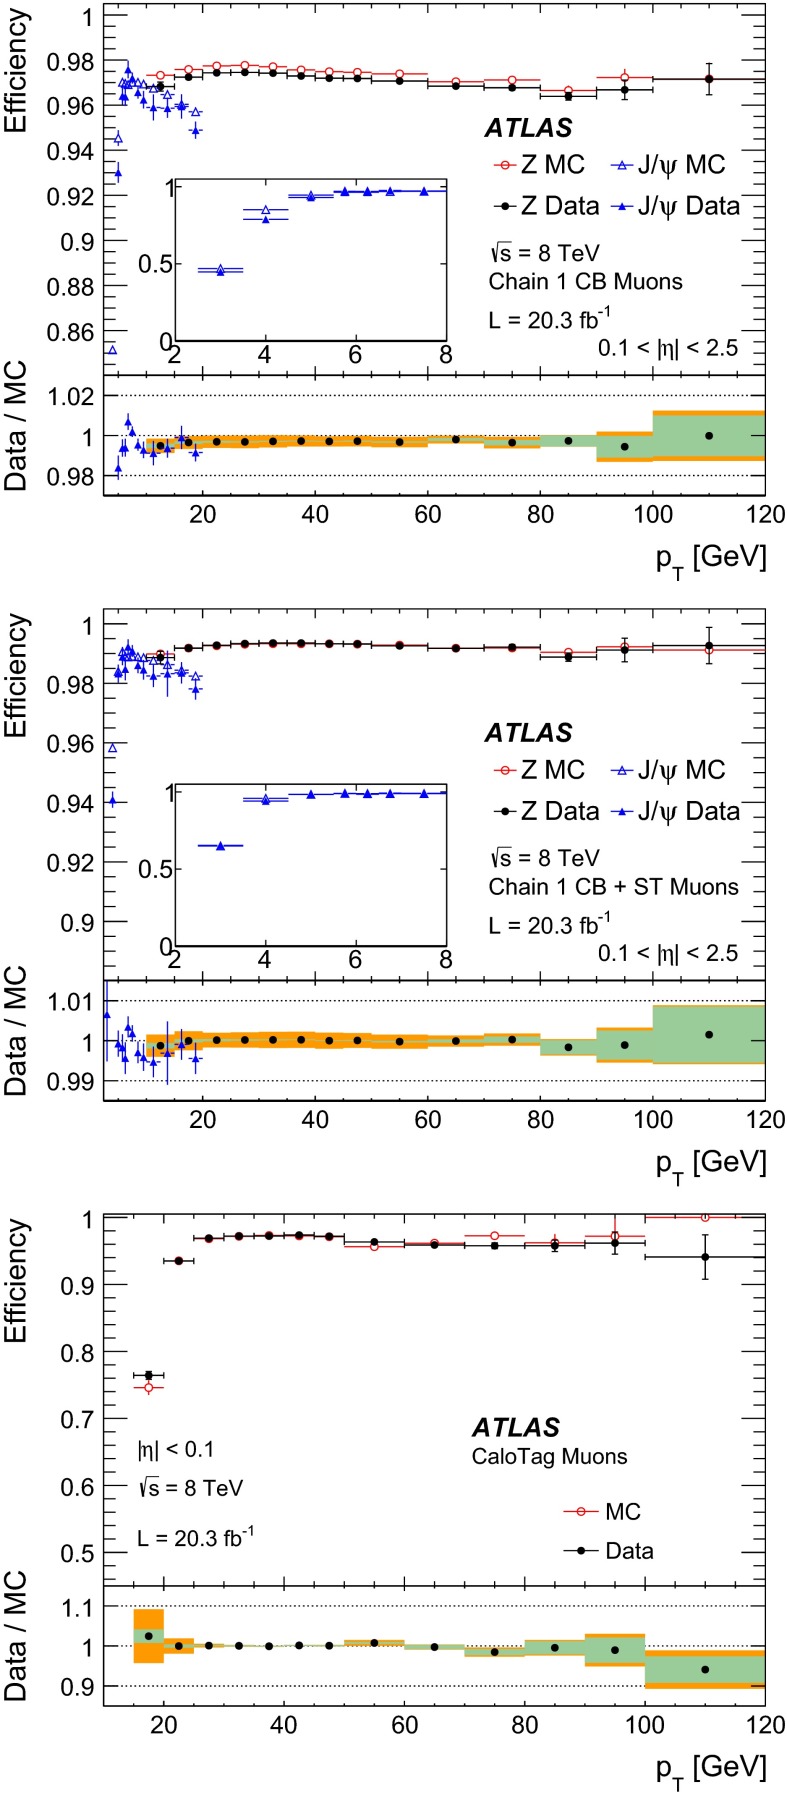
Fig. 5.
Reconstruction efficiency for CB (top), CB+ST (middle) and CaloTag (bottom) muons as a function of the of the muon, for muons with for CB and CB+ST muons and for for CaloTag muons. The upper two plots also show the result obtained with and events. The insets on the upper plots show the detail of the efficiency as a function of in the low region. The CaloTag muon efficiency (bottom) is only measured with events. The error bars on the efficiencies indicate the statistical uncertainty for and include also the fit model uncertainty for . The panel at the bottom shows the ratio between the measured and predicted efficiencies. The green areas show the pure statistical uncertainty, while the orange areas also include systematic uncertainties

