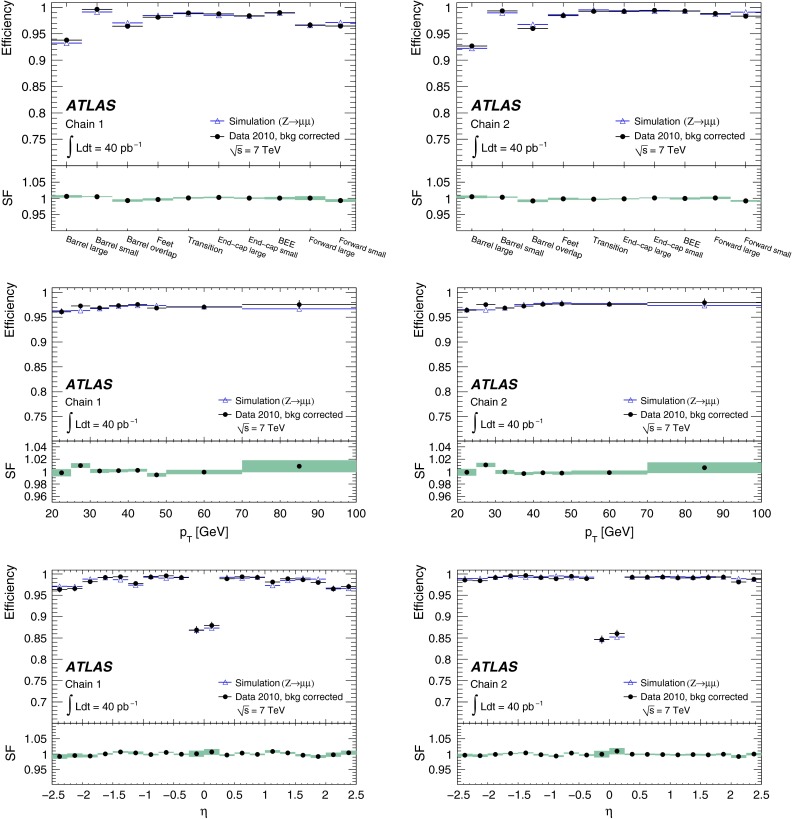
Fig. 12.

Efficiencies for CB+ST muons (from decays), for the two reconstruction chains as a function of detector region, muon and muon as indicated in the figure. The efficiencies are obtained from data with background correction and from Monte Carlo simulation of the signal. The corresponding scale factors are shown in the lower panel of each plot. The uncertainties are statistical only. The systematic uncertainty is discussed in Sect. 8.4
