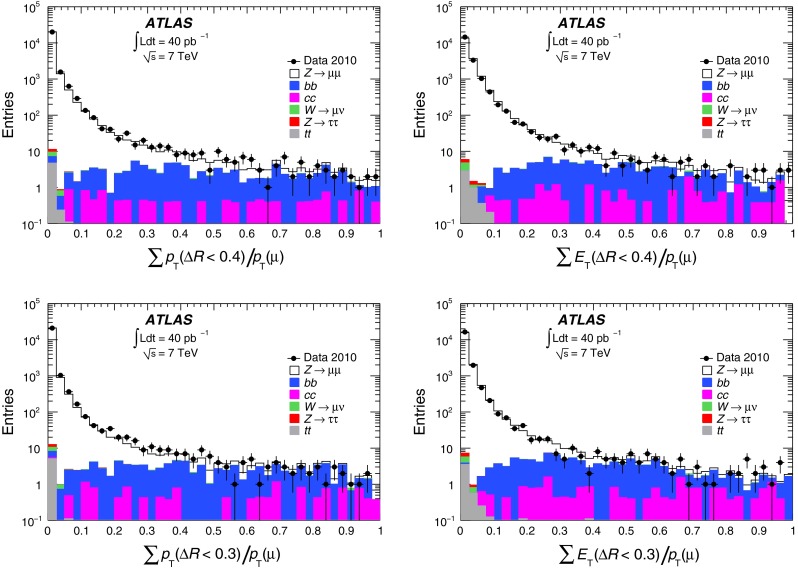
Fig. 13.

Comparison of the measured track isolation (left) and calorimeter isolation (right) distributions of the probe muon (from decays) with the Monte Carlo predictions, for two different cone sizes using the isolation variables defined in the text. The upper and lower plots correspond to and , respectively. The simulation includes the effects of pile-up, as described in the text. The uncertainties are statistical
