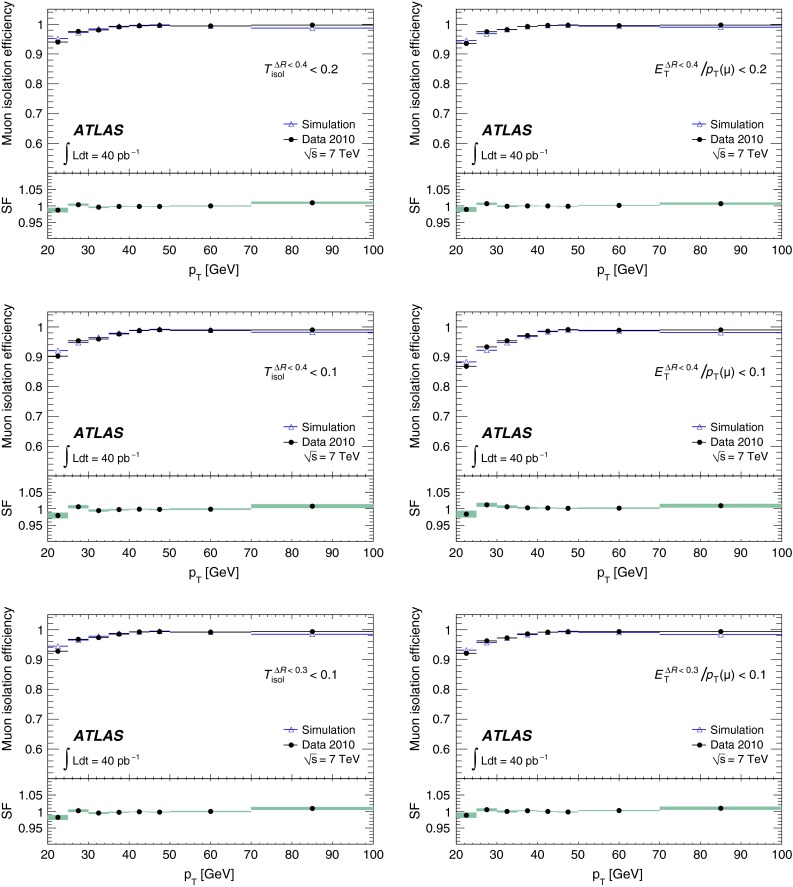
Fig. 14.

Isolation efficiencies for muons from decays as a function of , for track isolation (left) and calorimeter isolation (right) requirements with different isolation cone radii, , as described in the legend. The Monte Carlo predictions include background processes as well as the signal. The uncertainties are statistical only
