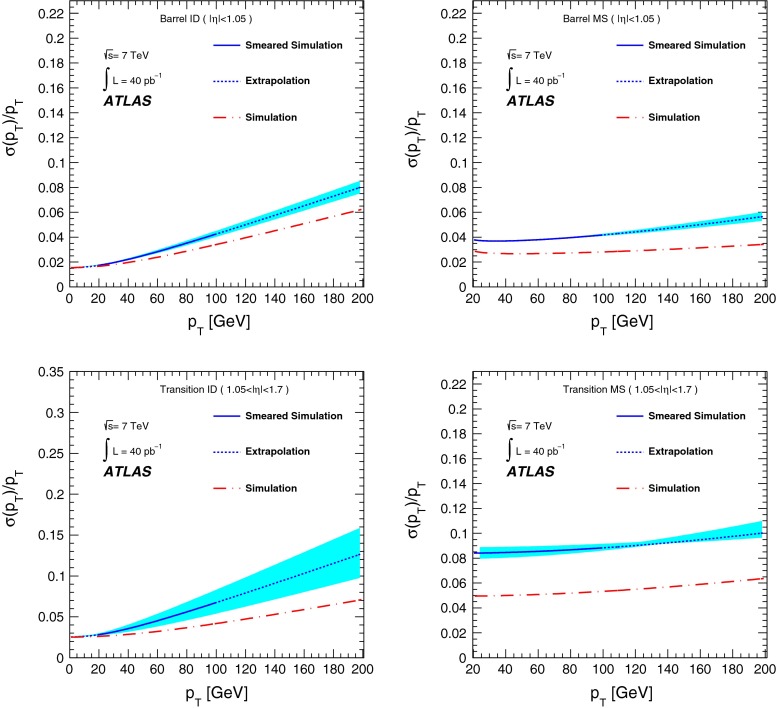
Fig. 17.
Muon momentum resolution as a function of for different barrel and transition regions as denoted in the legend. The dot-dash line is from a simulation which assumes perfect alignment of the ATLAS detector, whilst the solid/dotted line shows simulation smeared to reproduce the invariant mass resolution measured in data. The solid section of the line shows the range measured by and decays, and the dotted section the ‘extrapolation’ regions. The shaded bands show the uncertainty of the curves, computed from the uncertainties of the parameters derived in the resolution functions shown in Eqs. (3) and (4)

