. 2013 Mar 2;73(3):2306. doi: 10.1140/epjc/s10052-013-2306-0

Fig. 13.

Fig. 13

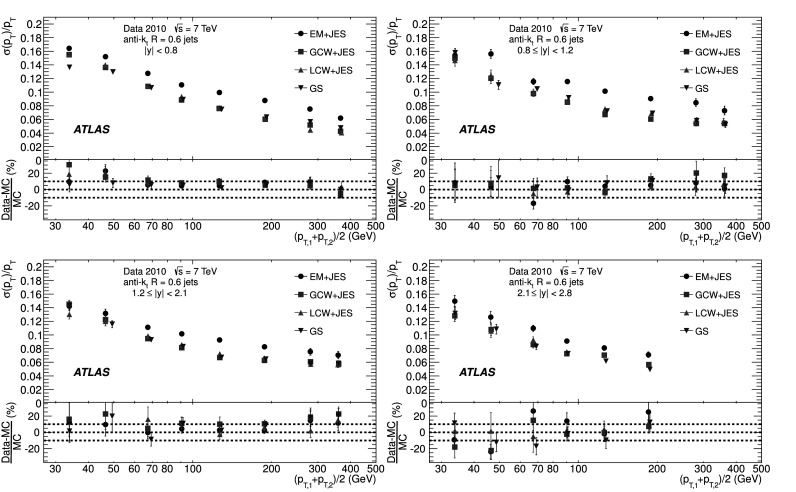
Fractional jet p T resolutions as a function of \documentclass[12pt]{minimal} \usepackage{amsmath} \usepackage{wasysym} \usepackage{amsfonts} \usepackage{amssymb} \usepackage{amsbsy} \usepackage{mathrsfs} \usepackage{upgreek} \setlength{\oddsidemargin}{-69pt} \begin{document}$\bar{p}_{\mathrm{T}}$\end{document} for anti-k t jets with R=0.6 with |y|<0.8 (top left), 0.8≤|y|<1.2 (top right), 1.2≤|y|<2.1 (bottom left) and 2.1≤|y|<2.8 (bottom right), using the bisector in situ method, for four jet calibration schemes: EM+JES, Local Cluster Weighting (LCW+JES), Global Cell Weighting (GCW+JES) and Global Sequential (GS). The lower panels show the relative difference between data and Monte Carlo simulation results. The dotted lines indicate relative differences of ±10 %. The errors shown are only statistical