. 2013 Mar 2;73(3):2306. doi: 10.1140/epjc/s10052-013-2306-0

Fig. 14.

Fig. 14

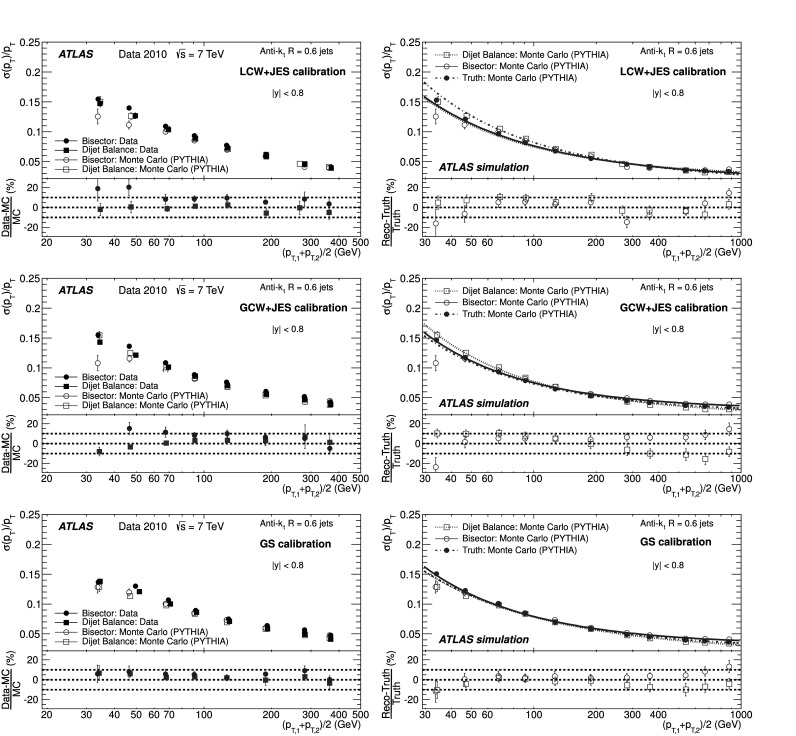
Fractional jet p T resolutions as a function of \documentclass[12pt]{minimal} \usepackage{amsmath} \usepackage{wasysym} \usepackage{amsfonts} \usepackage{amssymb} \usepackage{amsbsy} \usepackage{mathrsfs} \usepackage{upgreek} \setlength{\oddsidemargin}{-69pt} \begin{document}$\bar {p}_{\mathrm{T}}$\end{document} for anti-k t jets with R=0.6 for the Local Cluster Weighting (LCW+JES), Global Cell Weighting (GCW+JES) and Global Sequential (GS) calibrations. Left: Comparison of both in situ methods on data and MC simulation for |y|<0.8. The lower panels show the relative difference. Right: Comparison between the Monte Carlo simulation truth jet p T resolution and the final results obtained from the bisector and dijet balance in situ methods (applied to Monte Carlo simulation). The curves correspond to fits with the functional form in Eq. (9). The lower panel of the figure shows the relative difference between the in situ methods and the fit to the Monte Carlo truth results. The dotted lines indicate relative differences of ±10 %. The errors shown are only statistical