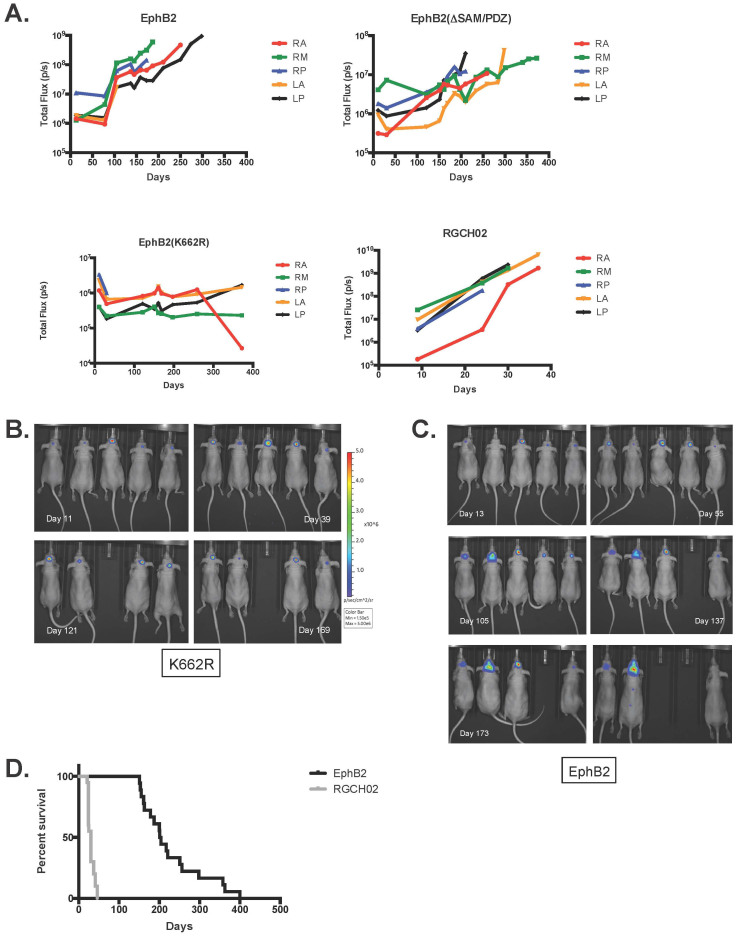
Figure 3. Luciferase activity of mice IC implanted with various EphB2 overexpressing Ink4a/Arf(−/−) STeNSCs.
(a) Graph of total luminescence (p/s) over time (days) for IC implanted Ink4a/Arf(−/−) STeNSCs retrovirally infected with MSCV-Luc (luciferase expressing retrovirus) and either EphB2 (top left), EphB2(K662R) (bottom left) or EphB2-ΔSAM/PDZ (top right). tdNSCs represents mice IC implanted with the tdNSC line RGCH02 (bottom right). Bioluminescence images of EphB2(K662R) (b) and EphB2 (c) IC implanted mice over time (days). (d) Survival curve of mice IC implanted with 1 × 10⁶ utNSCs (n = 18; black) or the tdNSC line RGCH02 (n = 20; grey). **** (p < 0.0001) vs. EphB2.

