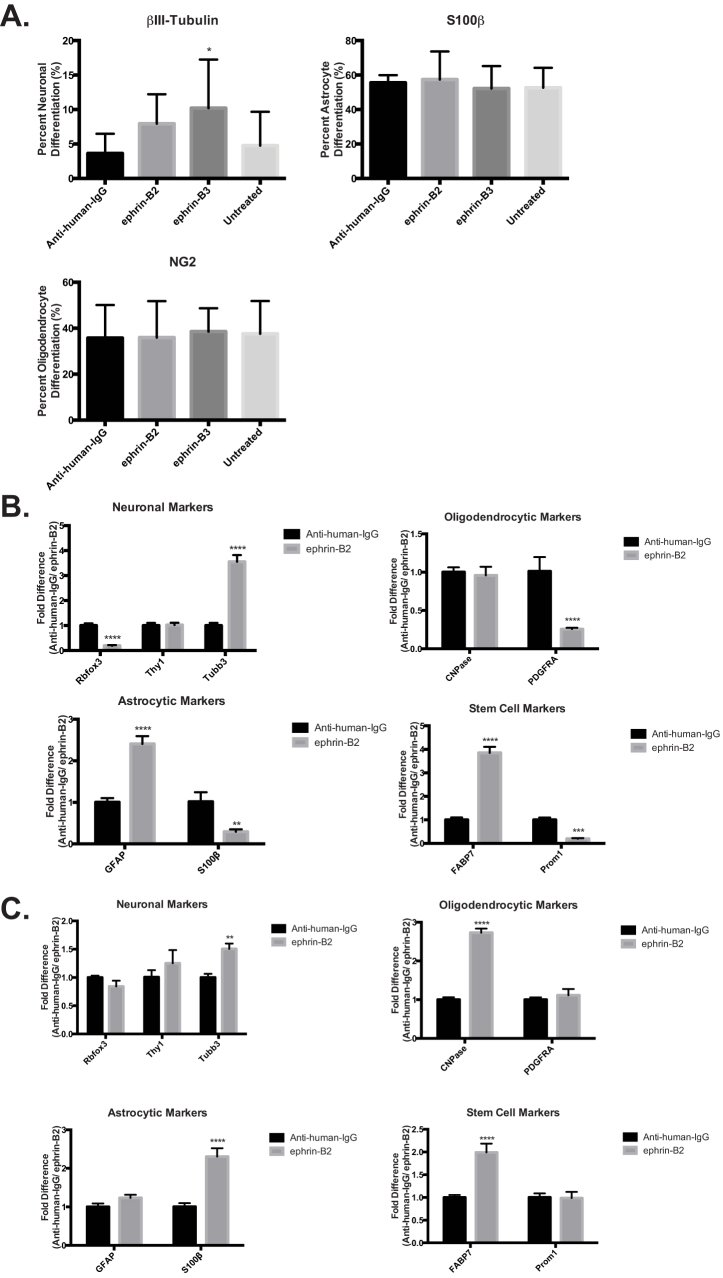
Figure 5. Ephrin-B ligand exposure specifically inhibits EphB2 driven tumor cell differentiation.
(a) Graph depicting the percent of utNSCs differentiated into astrocyte (βIII-tubulin), neuron (S100) or oligodendrocytes (NG2) after treatment with nothing (untreated), anti-human-IgG, ephrin-B2 or ephrin-B3. Neuronal type determined by immunofluorescent staining for neuronal lineage specific marker and cellular morphology. qPCR analysis of differentiation assay of tdNSCs (b) and utNSCs (c) treated with anti-human-IgG or ephrin-B2. All qPCR values are normalized to GAPDH. qPCR primer sets: Rbfox3 (NeuN), Thy1, Tubb3 (βIII-Tubulin), CNPase, PDGFRA, GFAP, S100β, FABP7 (Blbp), Prom1 (CD133). * (p < 0.05), ** (p < 0.01), *** (p < 0.005), and **** (p < 0.0001) vs. anti-human-IgG.

