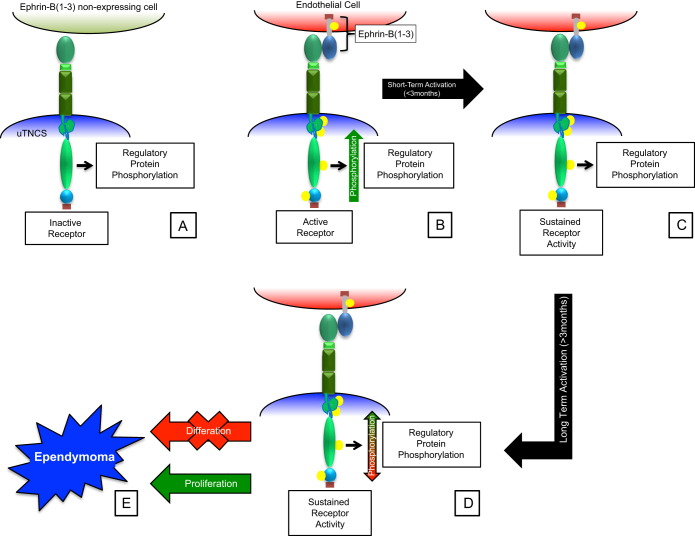
Figure 7. Schematic diagram of proposed model of EphB2 mediated ependymoma development.
(A) utNSCs within an ephrin-B ligand free microenvironment. (B) utNSCs within an ephrin-B ligand expressing microenvironment resulting in EphB2 activation and normal regulated ephrin signaling pathway activation. (C) Sustained EphB2 activation (<3months) but no accompanying change in regulatory protein phosphorylation (similar phosphorylation pattern as (A)). (D) Sustained EphB2 activation (>3months) with accompanying change in regulatory protein phosphorylation pattern (differing phosphorylation pattern from (A)). (E) Transformation into tdNSC as evident by inhibited differentiation and increased proliferation.

