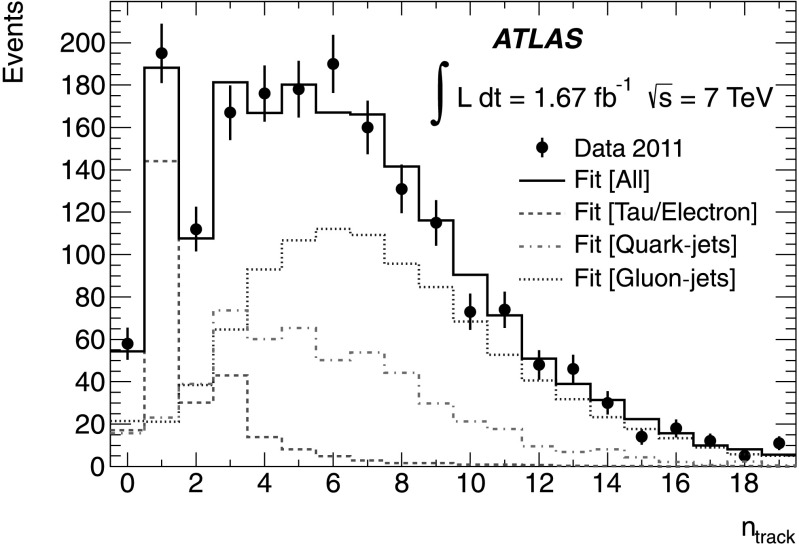
Fig. 2.
The n track distribution for τ had candidates after all selection cuts. The black points correspond to data, while the solid black line is the result of the fit. The red (dashed), blue (dotted) and magenta (dash-dotted) histograms show the fitted contributions from the tau/electron signal, and the gluon-jet and quark-jet backgrounds, respectively (Color figure online)

