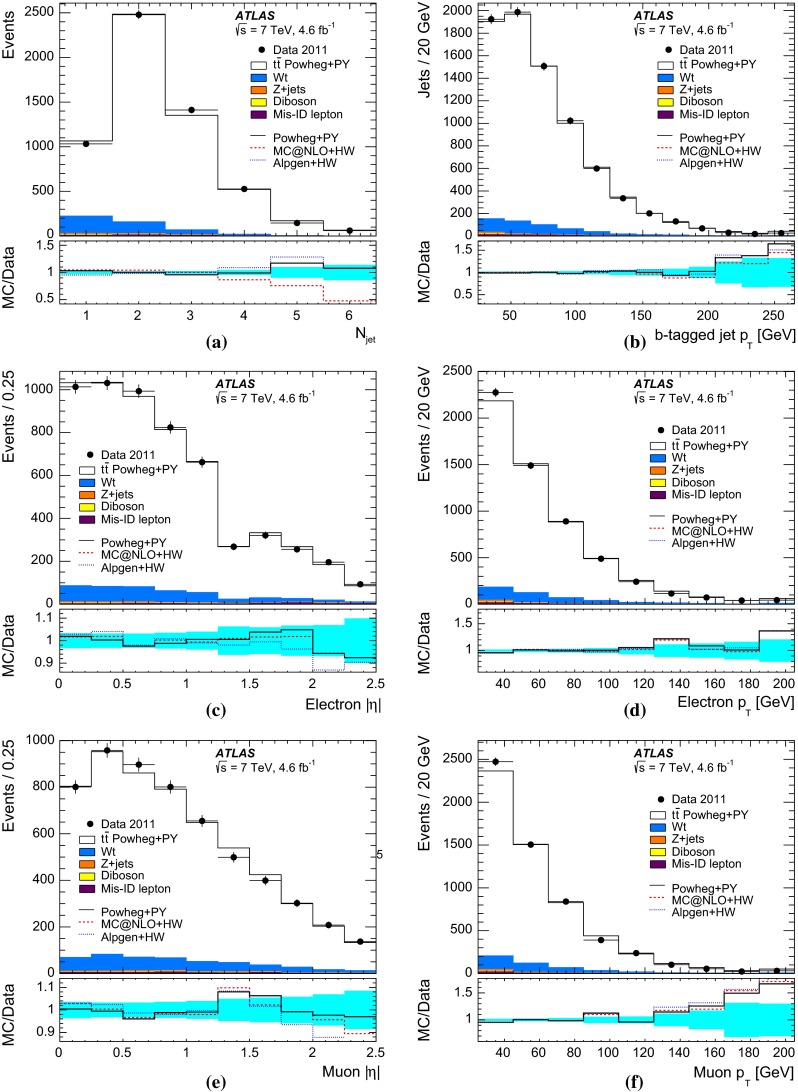
Fig. 2.

Distributions of a the number of jets, b the transverse momentum of the -tagged jets, c the of the electron, d the of the electron, e the of the muon and f the of the muon, in events with an opposite-sign pair and at least one -tagged jet. The data are compared to the expectation from simulation, broken down into contributions from , single top, +jets, dibosons, and events with misidentified electrons or muons, normalised to the same number of entries as the data. The lower parts of the figure show the ratios of simulation to data, using various signal samples and with the cyan band indicating the statistical uncertainty. The last bin includes the overflow
