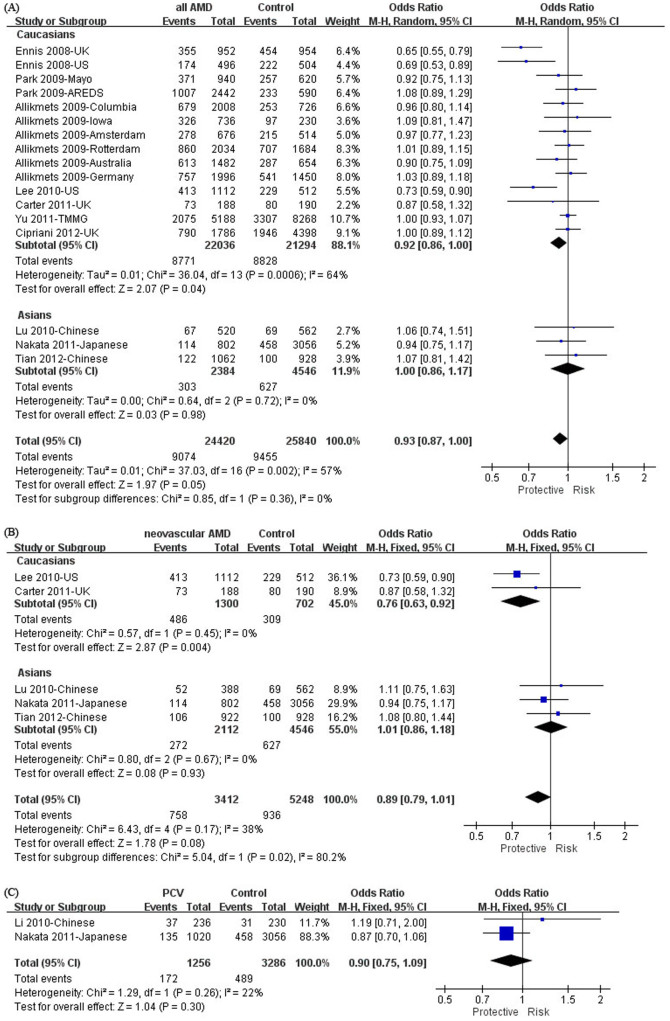
Figure 1. Forest plots of meta-analysis for rs2511989 in (A) all forms of AMD, (B) neovascular AMD, and (C) PCV.
Individual and pooled odds ratios (OR) were estimated for the A allele. Squares indicate the study-specific OR. The size of the box is proportional to the percent weight that each study contributed in the pooled OR. Horizontal lines indicate 95% confidence intervals (CI). A diamond indicates the pooled OR with 95% CI. “Events” mean the counts of the A allele. “Total” means the total allele counts in cases or controls. “Weight” indicates how much an individual study contributes to the pooled estimate. “H-M” stands for the Mantel-Haenszel method in meta-analysis. “Random” indicates that a random-effects method was adopted for generating the meta-analysis result. AMD: age-related macular degeneration; PCV: polypoidal choroidal vasculopathy.

