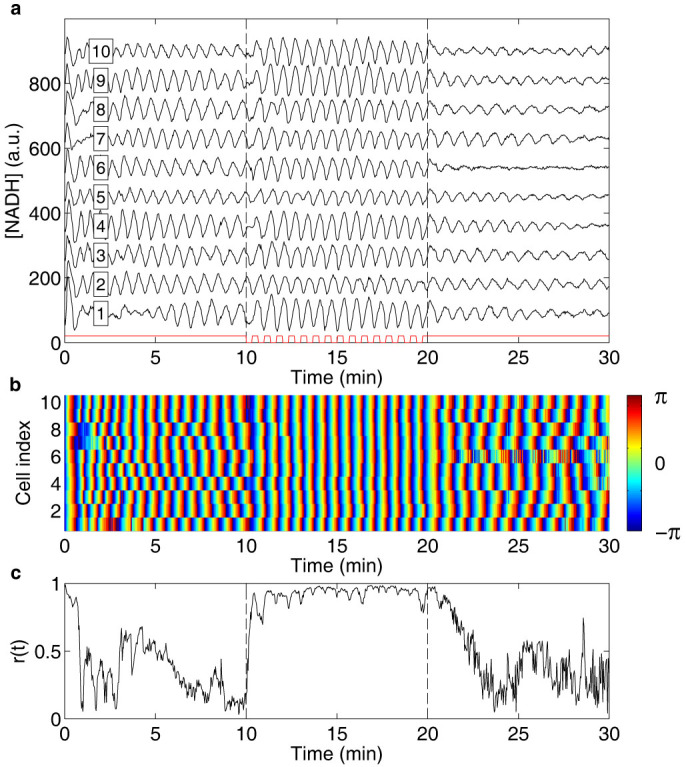
Figure 1. Entrainment of oscillations by removal of cyanide.

(a) Graph showing the NADH fluorescence intensity from individual cells (cell index in box), where each trace is offset 90 units for clarity. Oscillations are induced at time 0 of the experiment by exposing the cells to a solution containing 20 mM glucose + 5 mM cyanide. After 10 min, cell entrainment by removal of cyanide is investigated by periodically changing the flow rates in the inlet channels of the microfluidic flow chamber, causing a periodic change between the glucose/cyanide solution and a solution containing only 20 mM glucose with a period time of 40 s for a total of 15 periods. The time intervals during which the cells are exposed to cyanide are marked in red. As can be seen, the amplitude of the oscillations remains relatively unaffected by the perturbation. (b) Graph showing the phases of the oscillations of the individual cells shown in (a). Here it can be seen that the phases are shifted as the oscillations become entrained by the perturbation. (c) Graph showing the time dependent order parameter, calculated from the phases shown in (b). An order parameter close to unity indicates synchronisation, while a low value indicates a large heterogeneity of the phases. Here it is thus clear that the cells become entrained by the periodic removal of cyanide through phase shifts.
