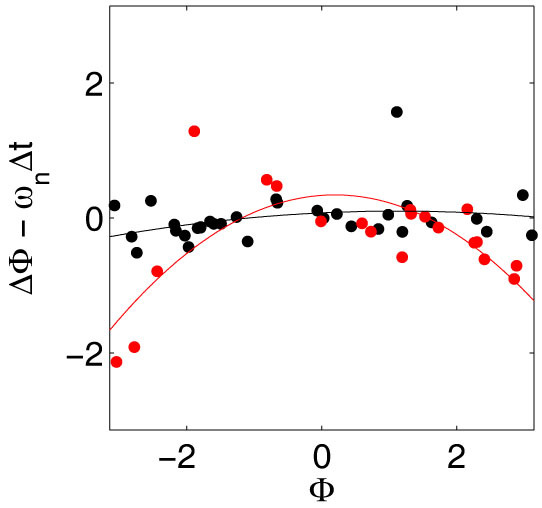
Figure 4. Fits of corrected phase shifts.

Graph showing the phase shifts calculated from the phases shown in Figure 3a, corrected with the expected phase shift if no entrainment by the perturbations occur, ωnΔt, where ωn is the frequency of the individual cells and Δt is the time between the measurements of the phases before and after the perturbation. The two data sets are fitted to second-degree polynomials (see equation (1) and Table 1 for parameter values), which reveals a significant difference between the values of the quadratic terms. Cells that have phases close to −π or π become negatively phase shifted when cyanide is removed, while cells which have phases close to that of the perturbation remain relatively unaffected by the perturbation.
