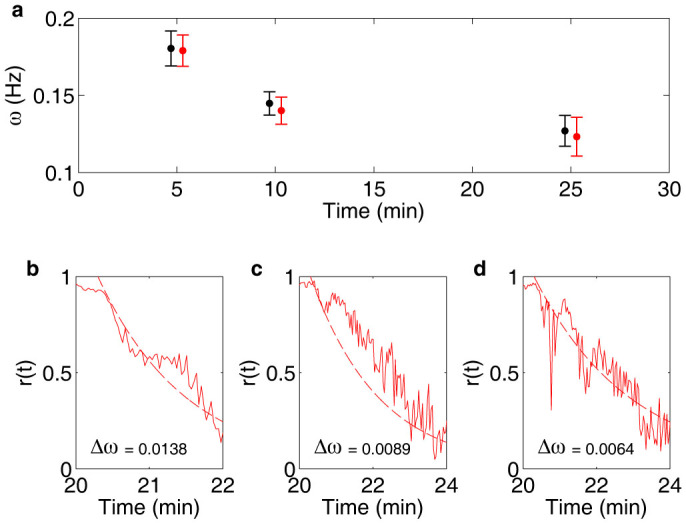
Figure 6. Heterogeneity of the frequency of the oscillations and its influence on the decay of the order parameter.

(a) Graph showing the frequency of the oscillations expressed as mean ± standard deviation, where data from experiments where cells were entrained is shown in red (N = 24), while data from control experiments is shown in black (N = 20). No significant difference between the two data sets can be seen, neither with respect to the mean values of the frequency nor to their distribution. That entrainment occurs despite the large heterogeneity of phases indicate that the synchronisation mechanism is robust. In (b)–(d) the decay of the order parameter is shown for three different experiments where cells were entrained (solid lines, N = 14, 10 and 10 respectively), together with exponential equations of the decay, where the rates are described by the distribution of frequencies Δω of the oscillations in the respective experiments (dashed lines, see equation (3)). The decay was set to start 18 s after the end of the experimental perturbation at 20 min. It can be seen that the decay rate of the order parameter well can be estimated by the frequency distribution among the individual cells in the experiments.
