
Table 1.
Demographic and Clinical Characteristics
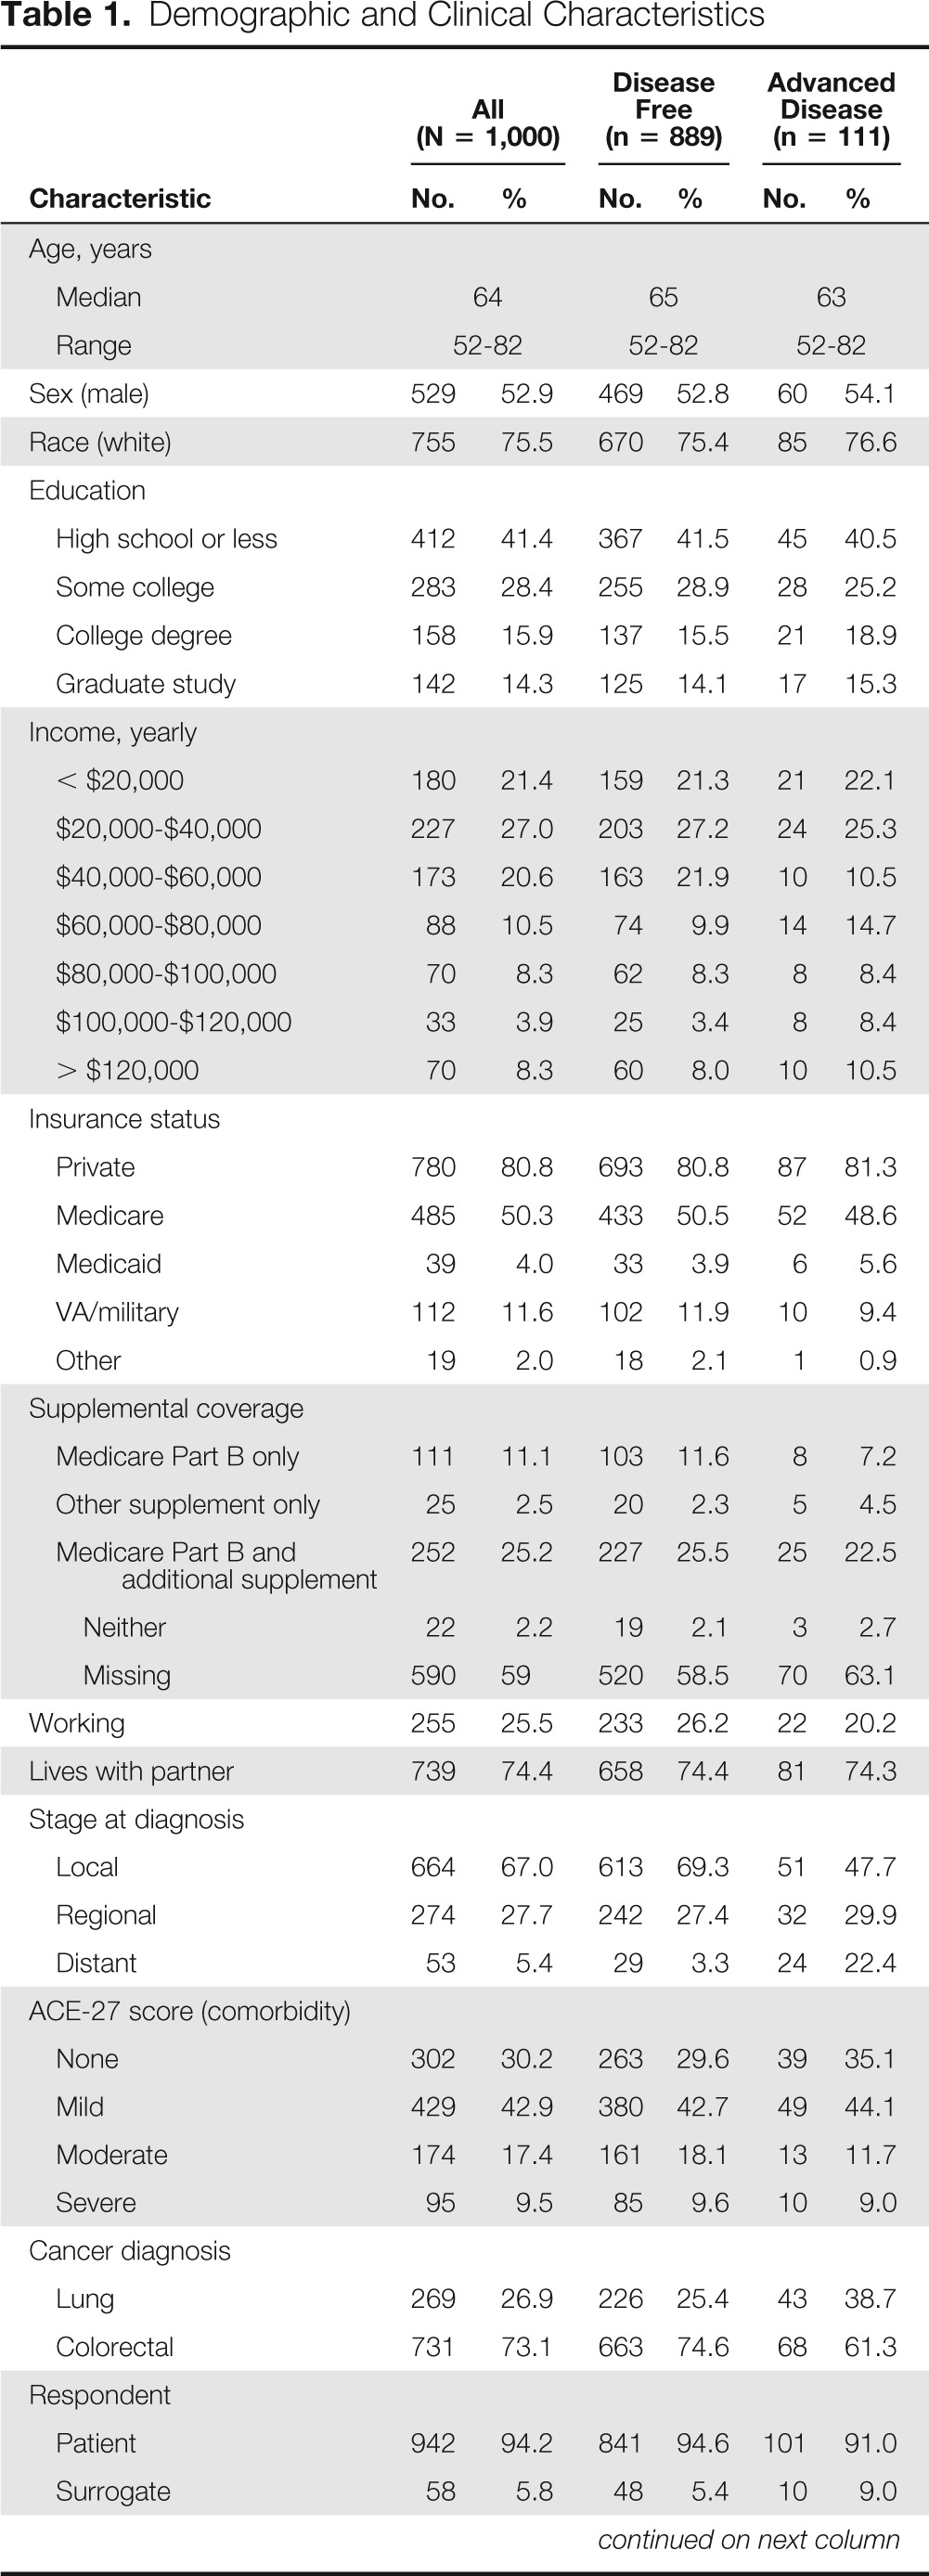
| Characteristic | All (N = 1,000) |
Disease Free (n = 889) |
Advanced Disease (n = 111) |
|||
|---|---|---|---|---|---|---|
| No. | % | No. | % | No. | % | |
| Age, years | ||||||
| Median | 64 | 65 | 63 | |||
| Range | 52-82 | 52-82 | 52-82 | |||
| Sex (male) | 529 | 52.9 | 469 | 52.8 | 60 | 54.1 |
| Race (white) | 755 | 75.5 | 670 | 75.4 | 85 | 76.6 |
| Education | ||||||
| High school or less | 412 | 41.4 | 367 | 41.5 | 45 | 40.5 |
| Some college | 283 | 28.4 | 255 | 28.9 | 28 | 25.2 |
| College degree | 158 | 15.9 | 137 | 15.5 | 21 | 18.9 |
| Graduate study | 142 | 14.3 | 125 | 14.1 | 17 | 15.3 |
| Income, yearly | ||||||
| < $20,000 | 180 | 21.4 | 159 | 21.3 | 21 | 22.1 |
| $20,000-$40,000 | 227 | 27.0 | 203 | 27.2 | 24 | 25.3 |
| $40,000-$60,000 | 173 | 20.6 | 163 | 21.9 | 10 | 10.5 |
| $60,000-$80,000 | 88 | 10.5 | 74 | 9.9 | 14 | 14.7 |
| $80,000-$100,000 | 70 | 8.3 | 62 | 8.3 | 8 | 8.4 |
| $100,000-$120,000 | 33 | 3.9 | 25 | 3.4 | 8 | 8.4 |
| > $120,000 | 70 | 8.3 | 60 | 8.0 | 10 | 10.5 |
| Insurance status | ||||||
| Private | 780 | 80.8 | 693 | 80.8 | 87 | 81.3 |
| Medicare | 485 | 50.3 | 433 | 50.5 | 52 | 48.6 |
| Medicaid | 39 | 4.0 | 33 | 3.9 | 6 | 5.6 |
| VA/military | 112 | 11.6 | 102 | 11.9 | 10 | 9.4 |
| Other | 19 | 2.0 | 18 | 2.1 | 1 | 0.9 |
| Supplemental coverage | ||||||
| Medicare Part B only | 111 | 11.1 | 103 | 11.6 | 8 | 7.2 |
| Other supplement only | 25 | 2.5 | 20 | 2.3 | 5 | 4.5 |
| Medicare Part B and additional supplement | 252 | 25.2 | 227 | 25.5 | 25 | 22.5 |
| Neither | 22 | 2.2 | 19 | 2.1 | 3 | 2.7 |
| Missing | 590 | 59 | 520 | 58.5 | 70 | 63.1 |
| Working | 255 | 25.5 | 233 | 26.2 | 22 | 20.2 |
| Lives with partner | 739 | 74.4 | 658 | 74.4 | 81 | 74.3 |
| Stage at diagnosis | ||||||
| Local | 664 | 67.0 | 613 | 69.3 | 51 | 47.7 |
| Regional | 274 | 27.7 | 242 | 27.4 | 32 | 29.9 |
| Distant | 53 | 5.4 | 29 | 3.3 | 24 | 22.4 |
| ACE-27 score (comorbidity) | ||||||
| None | 302 | 30.2 | 263 | 29.6 | 39 | 35.1 |
| Mild | 429 | 42.9 | 380 | 42.7 | 49 | 44.1 |
| Moderate | 174 | 17.4 | 161 | 18.1 | 13 | 11.7 |
| Severe | 95 | 9.5 | 85 | 9.6 | 10 | 9.0 |
| Cancer diagnosis | ||||||
| Lung | 269 | 26.9 | 226 | 25.4 | 43 | 38.7 |
| Colorectal | 731 | 73.1 | 663 | 74.6 | 68 | 61.3 |
| Respondent | ||||||
| Patient | 942 | 94.2 | 841 | 94.6 | 101 | 91.0 |
| Surrogate | 58 | 5.8 | 48 | 5.4 | 10 | 9.0 |
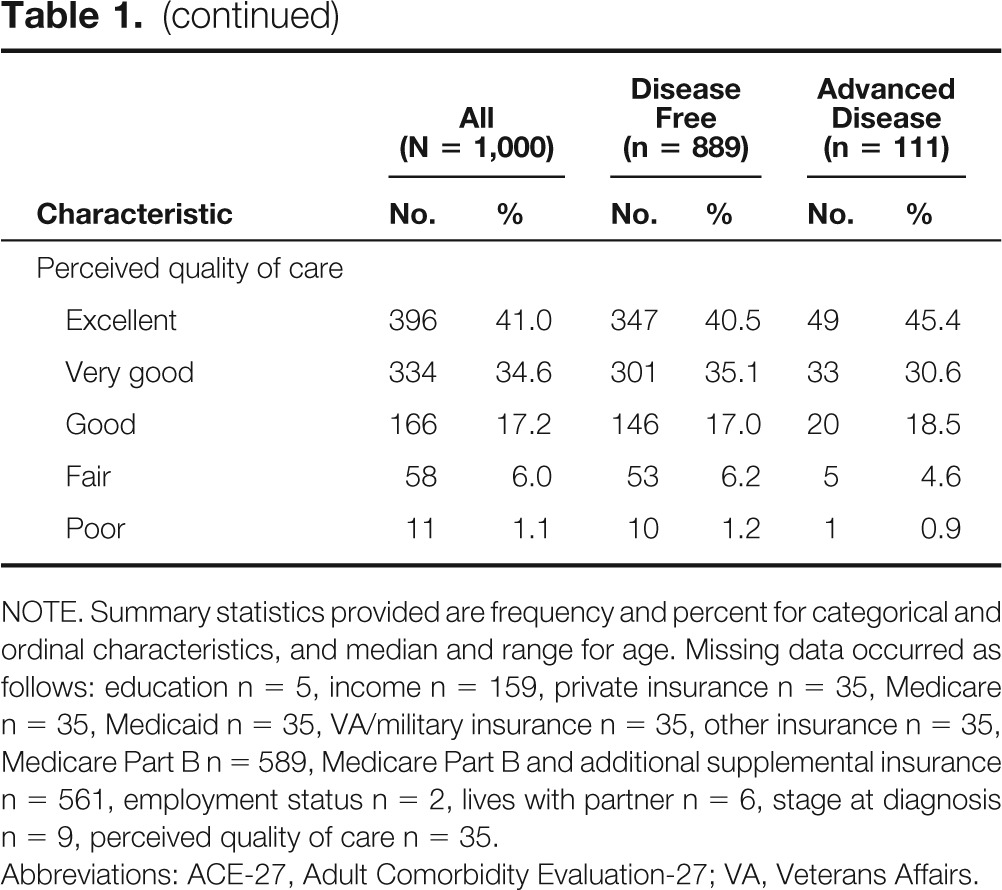
| Perceived quality of care | ||||||
| Excellent | 396 | 41.0 | 347 | 40.5 | 49 | 45.4 |
| Very good | 334 | 34.6 | 301 | 35.1 | 33 | 30.6 |
| Good | 166 | 17.2 | 146 | 17.0 | 20 | 18.5 |
| Fair | 58 | 6.0 | 53 | 6.2 | 5 | 4.6 |
| Poor | 11 | 1.1 | 10 | 1.2 | 1 | 0.9 |
NOTE. Summary statistics provided are frequency and percent for categorical and ordinal characteristics, and median and range for age. Missing data occurred as follows: education n = 5, income n = 159, private insurance n = 35, Medicare n = 35, Medicaid n = 35, VA/military insurance n = 35, other insurance n = 35, Medicare Part B n = 589, Medicare Part B and additional supplemental insurance n = 561, employment status n = 2, lives with partner n = 6, stage at diagnosis n = 9, perceived quality of care n = 35.
Abbreviations: ACE-27, Adult Comorbidity Evaluation-27; VA, Veterans Affairs.