
Table 2.
Measures of Financial Burden
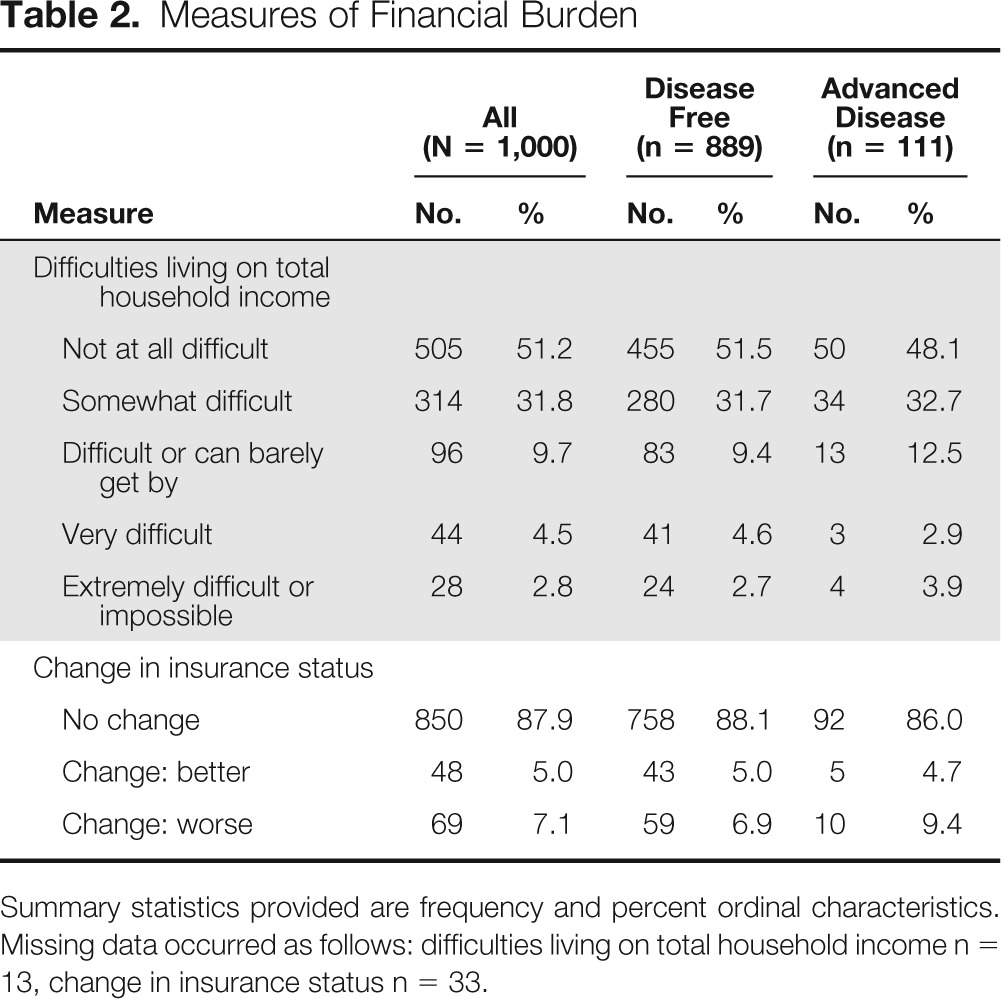
| Measure | All (N = 1,000) |
Disease Free (n = 889) |
Advanced Disease (n = 111) |
|||
|---|---|---|---|---|---|---|
| No. | % | No. | % | No. | % | |
| Difficulties living on total household income | ||||||
| Not at all difficult | 505 | 51.2 | 455 | 51.5 | 50 | 48.1 |
| Somewhat difficult | 314 | 31.8 | 280 | 31.7 | 34 | 32.7 |
| Difficult or can barely get by | 96 | 9.7 | 83 | 9.4 | 13 | 12.5 |
| Very difficult | 44 | 4.5 | 41 | 4.6 | 3 | 2.9 |
| Extremely difficult or impossible | 28 | 2.8 | 24 | 2.7 | 4 | 3.9 |
| Change in insurance status | ||||||
| No change | 850 | 87.9 | 758 | 88.1 | 92 | 86.0 |
| Change: better | 48 | 5.0 | 43 | 5.0 | 5 | 4.7 |
| Change: worse | 69 | 7.1 | 59 | 6.9 | 10 | 9.4 |
Summary statistics provided are frequency and percent ordinal characteristics. Missing data occurred as follows: difficulties living on total household income n = 13, change in insurance status n = 33.