
Table A1.
Path Model (adjusted)
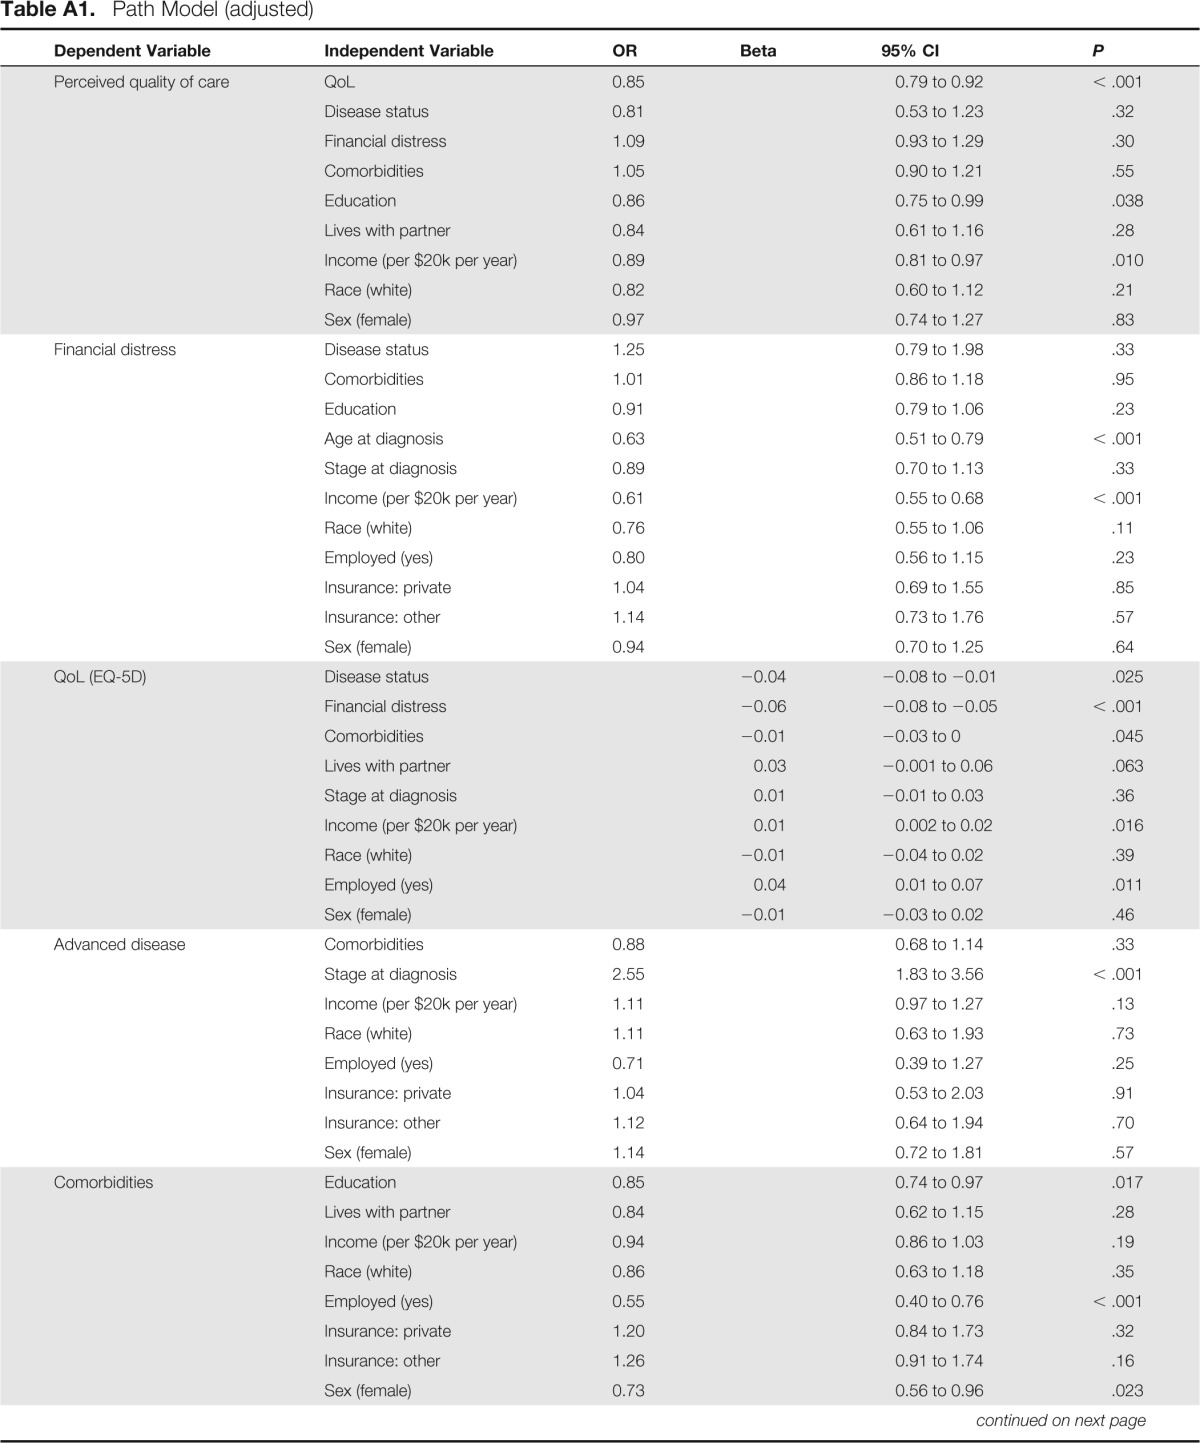
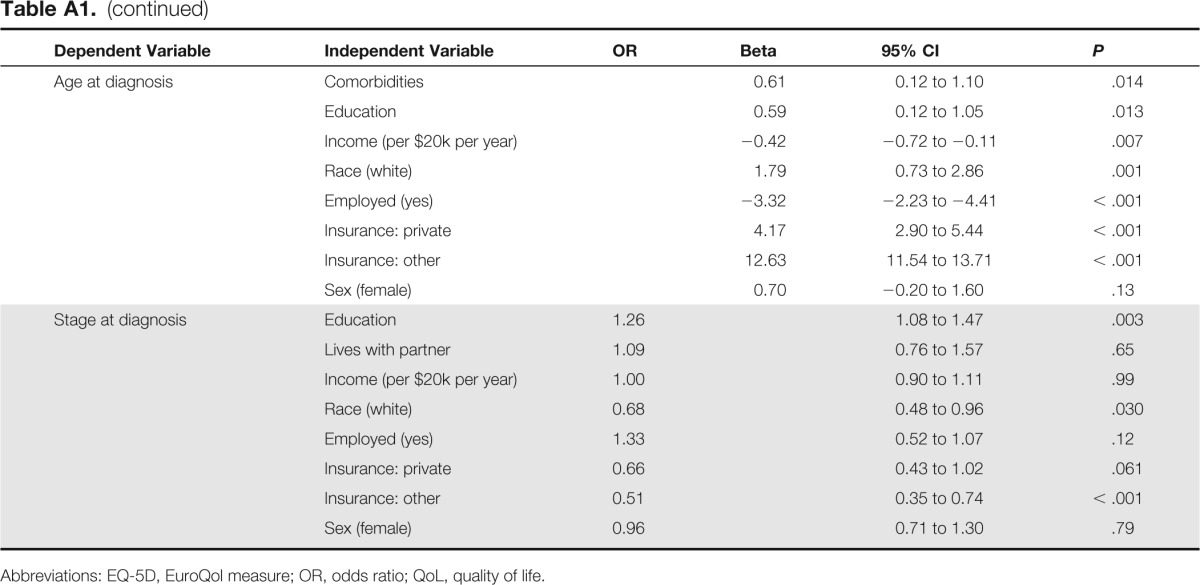
| Dependent Variable | Independent Variable | OR | Beta | 95% CI | P |
|---|---|---|---|---|---|
| Perceived quality of care | QoL | 0.85 | 0.79 to 0.92 | < .001 | |
| Disease status | 0.81 | 0.53 to 1.23 | .32 | ||
| Financial distress | 1.09 | 0.93 to 1.29 | .30 | ||
| Comorbidities | 1.05 | 0.90 to 1.21 | .55 | ||
| Education | 0.86 | 0.75 to 0.99 | .038 | ||
| Lives with partner | 0.84 | 0.61 to 1.16 | .28 | ||
| Income (per $20k per year) | 0.89 | 0.81 to 0.97 | .010 | ||
| Race (white) | 0.82 | 0.60 to 1.12 | .21 | ||
| Sex (female) | 0.97 | 0.74 to 1.27 | .83 | ||
| Financial distress | Disease status | 1.25 | 0.79 to 1.98 | .33 | |
| Comorbidities | 1.01 | 0.86 to 1.18 | .95 | ||
| Education | 0.91 | 0.79 to 1.06 | .23 | ||
| Age at diagnosis | 0.63 | 0.51 to 0.79 | < .001 | ||
| Stage at diagnosis | 0.89 | 0.70 to 1.13 | .33 | ||
| Income (per $20k per year) | 0.61 | 0.55 to 0.68 | < .001 | ||
| Race (white) | 0.76 | 0.55 to 1.06 | .11 | ||
| Employed (yes) | 0.80 | 0.56 to 1.15 | .23 | ||
| Insurance: private | 1.04 | 0.69 to 1.55 | .85 | ||
| Insurance: other | 1.14 | 0.73 to 1.76 | .57 | ||
| Sex (female) | 0.94 | 0.70 to 1.25 | .64 | ||
| QoL (EQ-5D) | Disease status | −0.04 | −0.08 to −0.01 | .025 | |
| Financial distress | −0.06 | −0.08 to −0.05 | < .001 | ||
| Comorbidities | −0.01 | −0.03 to 0 | .045 | ||
| Lives with partner | 0.03 | −0.001 to 0.06 | .063 | ||
| Stage at diagnosis | 0.01 | −0.01 to 0.03 | .36 | ||
| Income (per $20k per year) | 0.01 | 0.002 to 0.02 | .016 | ||
| Race (white) | −0.01 | −0.04 to 0.02 | .39 | ||
| Employed (yes) | 0.04 | 0.01 to 0.07 | .011 | ||
| Sex (female) | −0.01 | −0.03 to 0.02 | .46 | ||
| Advanced disease | Comorbidities | 0.88 | 0.68 to 1.14 | .33 | |
| Stage at diagnosis | 2.55 | 1.83 to 3.56 | < .001 | ||
| Income (per $20k per year) | 1.11 | 0.97 to 1.27 | .13 | ||
| Race (white) | 1.11 | 0.63 to 1.93 | .73 | ||
| Employed (yes) | 0.71 | 0.39 to 1.27 | .25 | ||
| Insurance: private | 1.04 | 0.53 to 2.03 | .91 | ||
| Insurance: other | 1.12 | 0.64 to 1.94 | .70 | ||
| Sex (female) | 1.14 | 0.72 to 1.81 | .57 | ||
| Comorbidities | Education | 0.85 | 0.74 to 0.97 | .017 | |
| Lives with partner | 0.84 | 0.62 to 1.15 | .28 | ||
| Income (per $20k per year) | 0.94 | 0.86 to 1.03 | .19 | ||
| Race (white) | 0.86 | 0.63 to 1.18 | .35 | ||
| Employed (yes) | 0.55 | 0.40 to 0.76 | < .001 | ||
| Insurance: private | 1.20 | 0.84 to 1.73 | .32 | ||
| Insurance: other | 1.26 | 0.91 to 1.74 | .16 | ||
| Sex (female) | 0.73 | 0.56 to 0.96 | .023 | ||
| Age at diagnosis | Comorbidities | 0.61 | 0.12 to 1.10 | .014 | |
| Education | 0.59 | 0.12 to 1.05 | .013 | ||
| Income (per $20k per year) | −0.42 | −0.72 to −0.11 | .007 | ||
| Race (white) | 1.79 | 0.73 to 2.86 | .001 | ||
| Employed (yes) | −3.32 | −2.23 to −4.41 | < .001 | ||
| Insurance: private | 4.17 | 2.90 to 5.44 | < .001 | ||
| Insurance: other | 12.63 | 11.54 to 13.71 | < .001 | ||
| Sex (female) | 0.70 | −0.20 to 1.60 | .13 | ||
| Stage at diagnosis | Education | 1.26 | 1.08 to 1.47 | .003 | |
| Lives with partner | 1.09 | 0.76 to 1.57 | .65 | ||
| Income (per $20k per year) | 1.00 | 0.90 to 1.11 | .99 | ||
| Race (white) | 0.68 | 0.48 to 0.96 | .030 | ||
| Employed (yes) | 1.33 | 0.52 to 1.07 | .12 | ||
| Insurance: private | 0.66 | 0.43 to 1.02 | .061 | ||
| Insurance: other | 0.51 | 0.35 to 0.74 | < .001 | ||
| Sex (female) | 0.96 | 0.71 to 1.30 | .79 |
Abbreviations: EQ-5D, EuroQol measure; OR, odds ratio; QoL, quality of life.