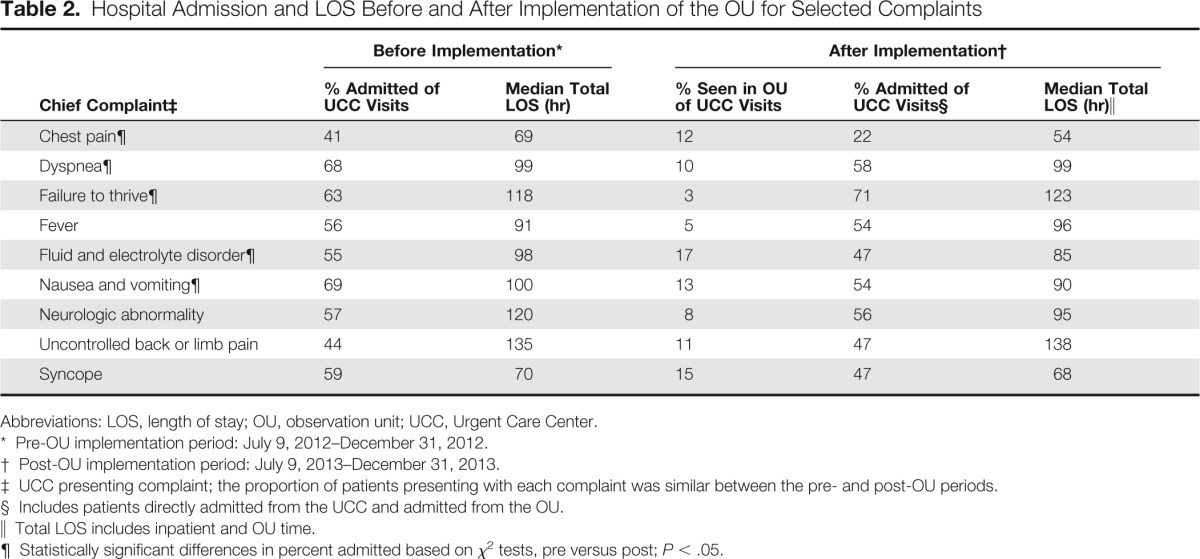
Table 2.
Hospital Admission and LOS Before and After Implementation of the OU for Selected Complaints

| Chief Complaint‡ | Before Implementation* |
After Implementation† |
|||
|---|---|---|---|---|---|
| % Admitted of UCC Visits | Median Total LOS (hr) | % Seen in OU of UCC Visits | % Admitted of UCC Visits§ | Median Total LOS (hr)∥ | |
| Chest pain¶ | 41 | 69 | 12 | 22 | 54 |
| Dyspnea¶ | 68 | 99 | 10 | 58 | 99 |
| Failure to thrive¶ | 63 | 118 | 3 | 71 | 123 |
| Fever | 56 | 91 | 5 | 54 | 96 |
| Fluid and electrolyte disorder¶ | 55 | 98 | 17 | 47 | 85 |
| Nausea and vomiting¶ | 69 | 100 | 13 | 54 | 90 |
| Neurologic abnormality | 57 | 120 | 8 | 56 | 95 |
| Uncontrolled back or limb pain | 44 | 135 | 11 | 47 | 138 |
| Syncope | 59 | 70 | 15 | 47 | 68 |
Abbreviations: LOS, length of stay; OU, observation unit; UCC, Urgent Care Center.
Pre-OU implementation period: July 9, 2012–December 31, 2012.
Post-OU implementation period: July 9, 2013–December 31, 2013.
UCC presenting complaint; the proportion of patients presenting with each complaint was similar between the pre- and post-OU periods.
Includes patients directly admitted from the UCC and admitted from the OU.
Total LOS includes inpatient and OU time.
Statistically significant differences in percent admitted based on χ2 tests, pre versus post; P < .05.
