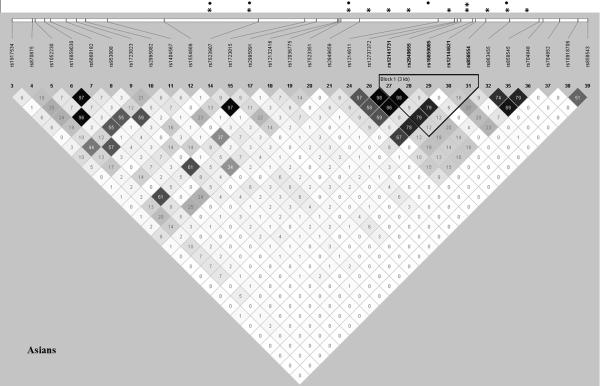
Figure 2.
Linkage disequilibrium plot for the 30 genotyped single-nucleotide polymorphisms (SNPs) in CD247 in the Asian population. This plot was obtained using the genotyping data from our study with Haploview 4.2 using the pairwise R-square color scheme in a grey scale. The position of the most significantly associated haplotype is indicated. *Significant P-value under the additive model and adjusted for the first three principal components and gender (Padj<0.05); **Significant P-value overpassing Bonferroni correction (Padj<0.0017); ●Significant P-value from the association analysis conditioned on the most significantly associated SNP, rs858554 (Pcond<0.05).

