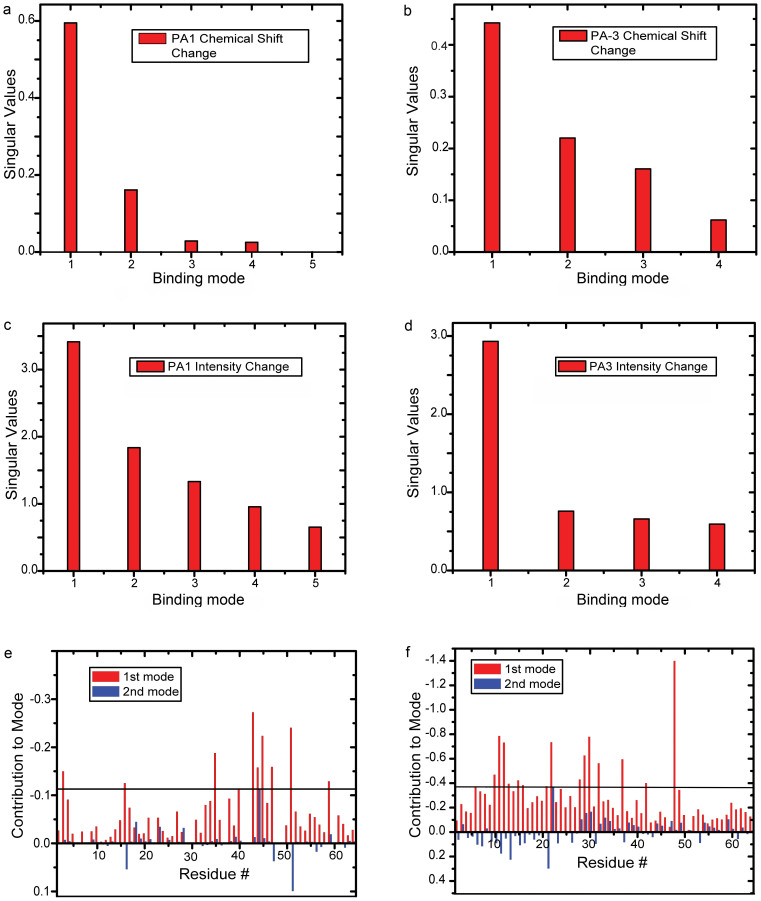
Figure 3. SVD analyses of in-cell Pup-PA-1 and Pup-PA-3 interactions.
Matrices consisting of chemical shift changes, MCSC, and intensity changes, MIC, in in-cell [U-15N] Pup peaks over the time course of PA-1 and PA-3 overexpression were analyzed29 to identify Pup residues involved in PA binding. The scree plots show the distribution of singular values that define the relative contribution of each binding mode to the MCSC or MIC, respectively. (a) and (d) The first binding mode contributes to 92.6% of the MCSC for Pup-PA-1 and 86.3% of the MIC for Pup-PA-3, indicating that it is a principal binding mode. A clear drop in the progression of singular values is evident after the first singular value and R2 values for the linear regressions are poor, 0.75 and 0.65 for (a) and (d), respectively. (b) and (c) The first binding mode contributes to 62% of the MCSC for Pup-PA-1 and 64% of the MIC for Pup-PA-3. No clear drop in singular values is evident and the R2 values for the linear regressions are high, 0.91 and 0.93 for (b) and (c), respectively, precluding the data from identifying principal binding modes in these cases. (e) and (f) The contribution of Pup residues to the first and second binding mode with PAs is shown in red and blue bars, respectively. There are two bars per residue. The maximum contribution of Pup residues to the second mode is used as a threshold to identify Pup residues affected by PA binding.

