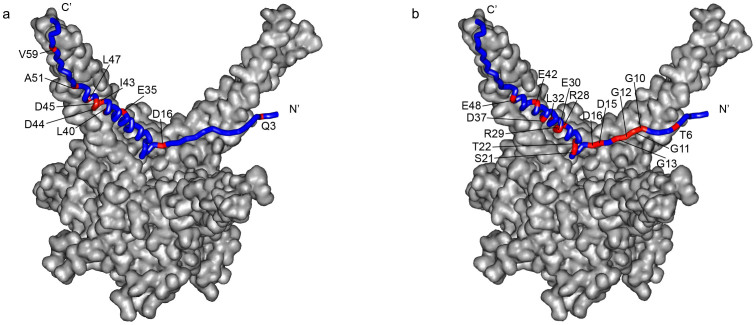
Figure 4. PA-1 and PA-3 bind to distinct sites on Pup.
Pup residues (shown in red) identified by SVD analysis to be affected by PA-1 (a) and PA-3 (b) binding are mapped onto the Pup-Mpa complex30. Some labeled residues in (a) and (b) are obscured due to image orientation. The image of the Pup-Mpa structure (PDB code 3M9D) was constructed by using Modeller45.

