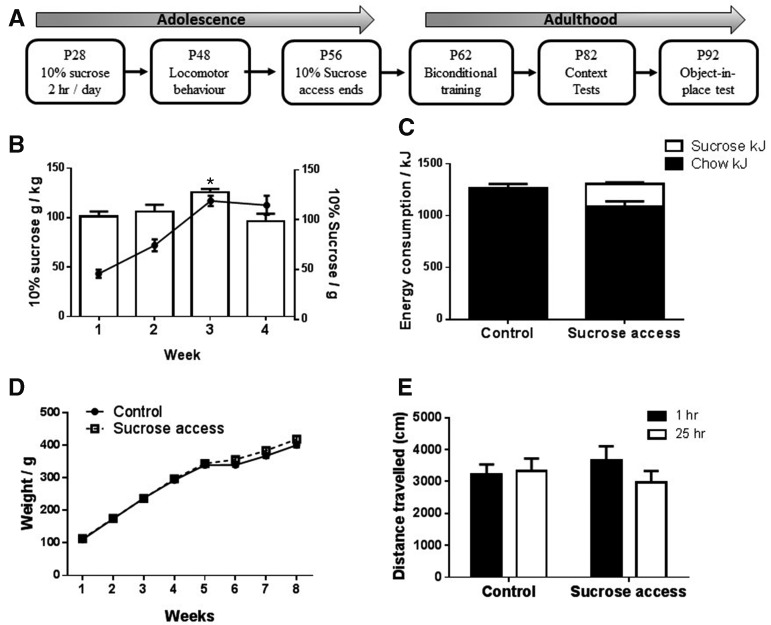
Figure 1.
(A) Time line of experimental manipulations. (B) Line graph illustrates sucrose intake per cage of four rats each week (gram solution/cage/day) while the histogram reports gram sucrose consumed per kilogram body weight. (C) Mean 24-h energy consumption (kilojoules) per cage of four rats in week 4 (chow in solid and sucrose in open bar). (D) Mean weights of rats in control and sucrose access groups. (E) Mean distance traveled during 20-min locomotor testing. Error bars represent SEM, Control N = 16, Sucrose = 16. (*) P < 0.05.

