
Table 1. Affymetrix analysis.
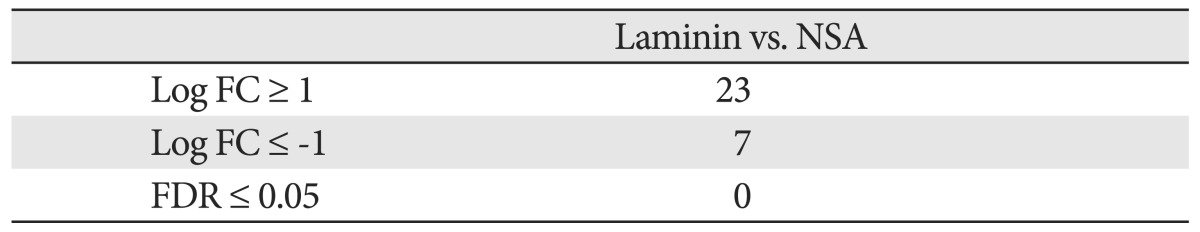
Affymetrix analysis with number of probes shown. Laminin and neurosphere assay (NSA) glioblastoma (GBM) cells were compared. For statistically significant differences, false discovery rate (FDR) was set at ≤0.05 and no genetic expression differences were found between laminin and NSA GBM cells. FC, fold change.