
Figure 3.
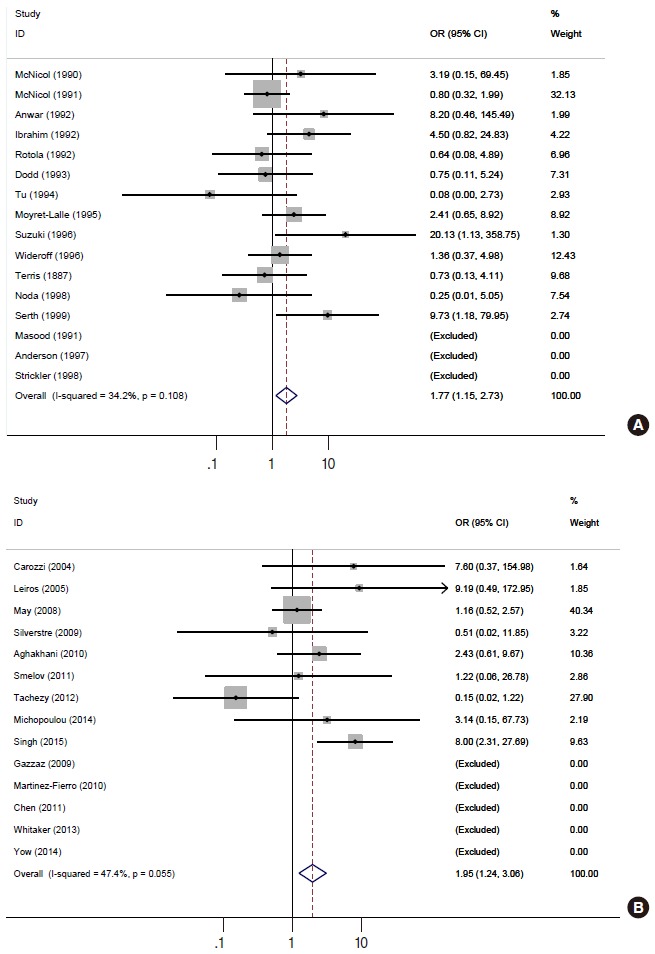
Forest plots of subgroup analyses according to publication year before (n=16, A) and after 2000 (n=14, B). OR, odds ratio; CI, confidence interval.
Official websites use .gov
A
.gov website belongs to an official
government organization in the United States.
Secure .gov websites use HTTPS
A lock (
) or https:// means you've safely
connected to the .gov website. Share sensitive
information only on official, secure websites.
Forest plots of subgroup analyses according to publication year before (n=16, A) and after 2000 (n=14, B). OR, odds ratio; CI, confidence interval.