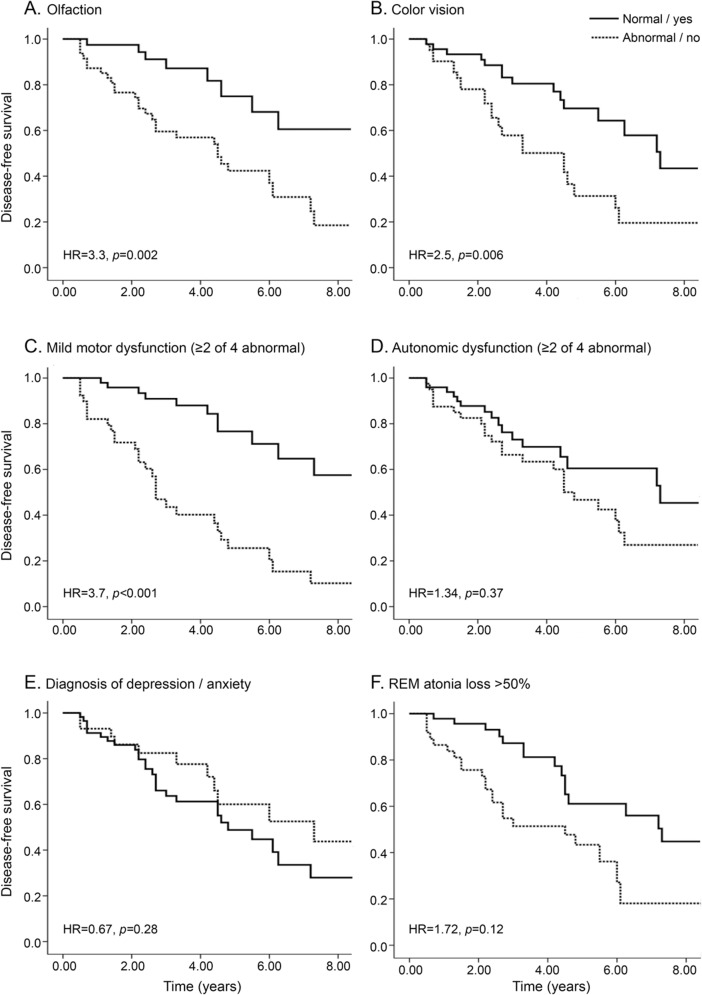
Figure 2. Predictive markers of neurodegeneration in idiopathic RBD.
Shown is the Kaplan-Meier plot of disease-free survival of patients with idiopathic REM sleep behavior disorder (RBD), stratified according to presence of baseline markers: (A) olfaction, (B) color vision, (C) mild motor dysfunction, (D) autonomic dysfunction, (E) depression/anxiety, and (F) REM atonia loss. To mimic a clinical trial recruitment strategy, results are presented according to baseline assessment only (i.e., patients who develop a de novo marker abnormality over the course of the follow-up remain in the “marker-free” group). Solid line indicates patients with normal values, dashed line abnormal values. The 50% REM atonia (F) is for percentage tonic REM. Hazard ratios (HRs) are with Cox proportional hazards, adjusting for age and sex.

