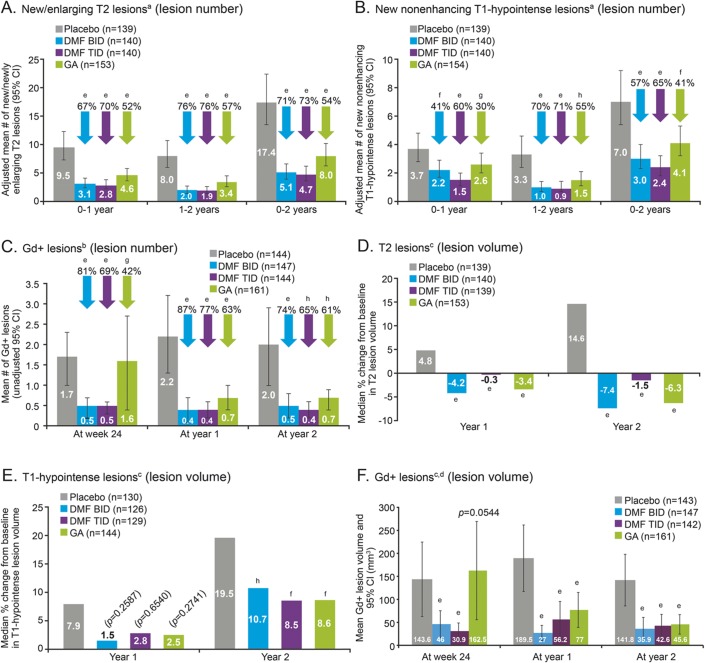
Figure 2. Lesion number (A–C) and volume (D–F) of T2 lesions, T1-hypointense lesions, and Gd+ lesions over time.
Patient numbers refer to those who provided data both at baseline and at each scheduled MRI analysis. Relative reductions (vs placebo) in the risk of having a greater number of gadolinium-enhancing (Gd+) lesions were based on the odds ratio from the prespecified analysis model of ordinal logistic regression (a conservative method, chosen to minimize undue influence of outlier Gd+ lesion counts on the estimated treatment effect), for categories of patients with 0, 1, 2, 3–4, and ≥5 lesions. Comparisons vs placebo were based on anegative binomial regression, adjusted for region and baseline lesion volume; bordinal regression, adjusted for region and baseline lesion number; and canalysis of covariance on ranked data, adjusted for region and baseline lesion volume. dThe comparison vs placebo of mean Gd+ lesion volume at postbaseline timepoints was a post hoc analysis (change from baseline was the prespecified analysis). ep < 0.0001; fp < 0.01; gp < 0.05; hp < 0.001 for comparison vs placebo. CI = confidence interval; DMF = delayed-release dimethyl fumarate (also known as gastro-resistant DMF); GA = glatiramer acetate.

