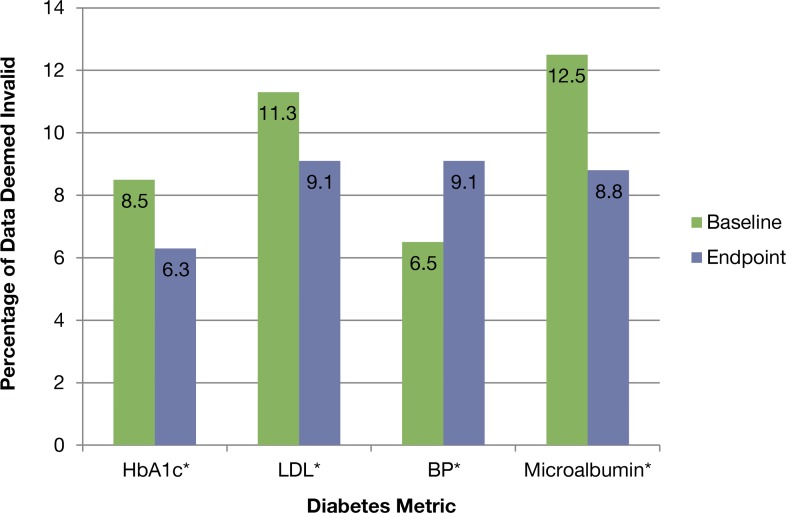
Figure 2.
Percentage of Registry Data Deemed Invalid: Baseline (Q1 2012) to Endpoint (Q2 2013)
Notes: *Difference (baseline to endpoint) is significantly different at p<.001. Values represent the percentage of reported data that were deemed invalid (value or date not within an acceptable range). Acceptable ranges for laboratory values were: HbA1c 1 – 100%; LDL 1 – 300 mg/dL; Systolic BP 50–300 mmHg; Diastolic BP 35–200 mmHg; microalbumin/creatinine ratio 0–5000. Valid dates were within 12 months prior to the registry run date.

