
Figure 1.
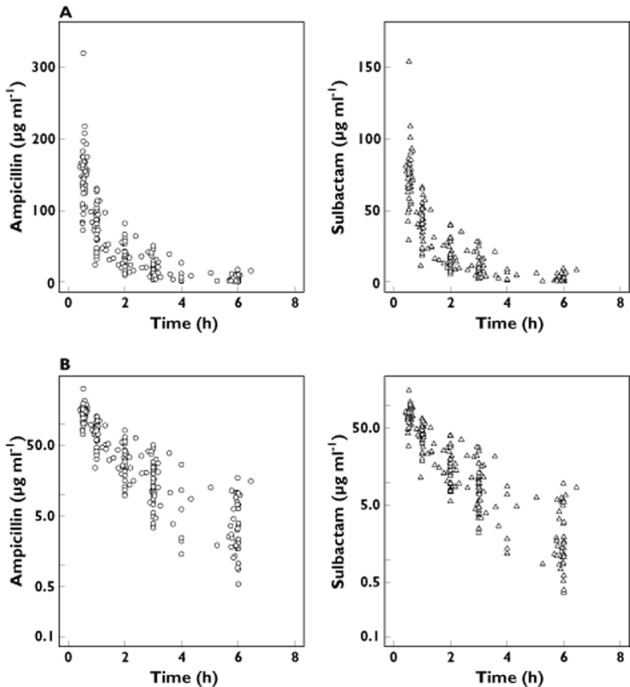
(A) Normal and (B) semilog-scaled observed plasma ampicillin and sulbactam concentrations vs. time profile. The time represents time after the start of the most recent intravenous infusion of ampicillin /sulbactam 3 g four times daily
Official websites use .gov
A
.gov website belongs to an official
government organization in the United States.
Secure .gov websites use HTTPS
A lock (
) or https:// means you've safely
connected to the .gov website. Share sensitive
information only on official, secure websites.
(A) Normal and (B) semilog-scaled observed plasma ampicillin and sulbactam concentrations vs. time profile. The time represents time after the start of the most recent intravenous infusion of ampicillin /sulbactam 3 g four times daily