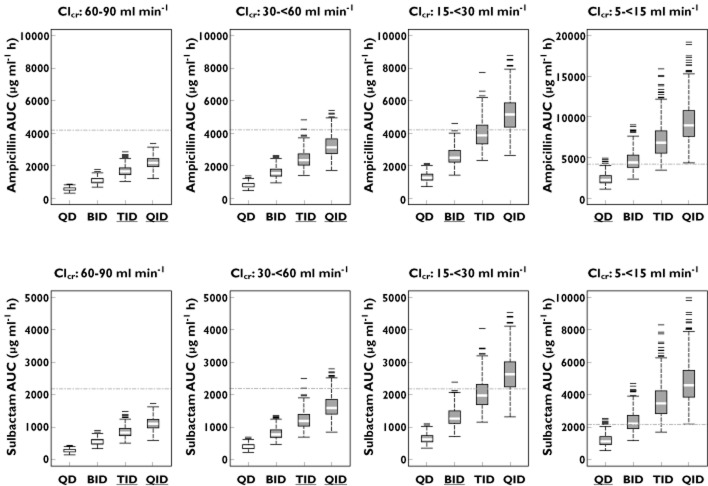
Figure 4.
Box plots of simulated AUC for ampicillin (upper panels) and sulbactam (lower panels) following multiple 30 min intravenous infusions of 3 g ampicillin/sulbactam for 3 days of treatment by different renal functions with different dosing intervals. The dotted line represents the highest observed AUC (empirical Bayesian estimate) following intravenous administrations of ampicillin/sulbactam 3 g four times daily in CAP patients. Note: dosing intervals with under bar (in x-axis) represent recommended dosing intervals. QD once daily dosing, BID twice daily dosing, TID three times daily dosing, QID four times daily dosing

