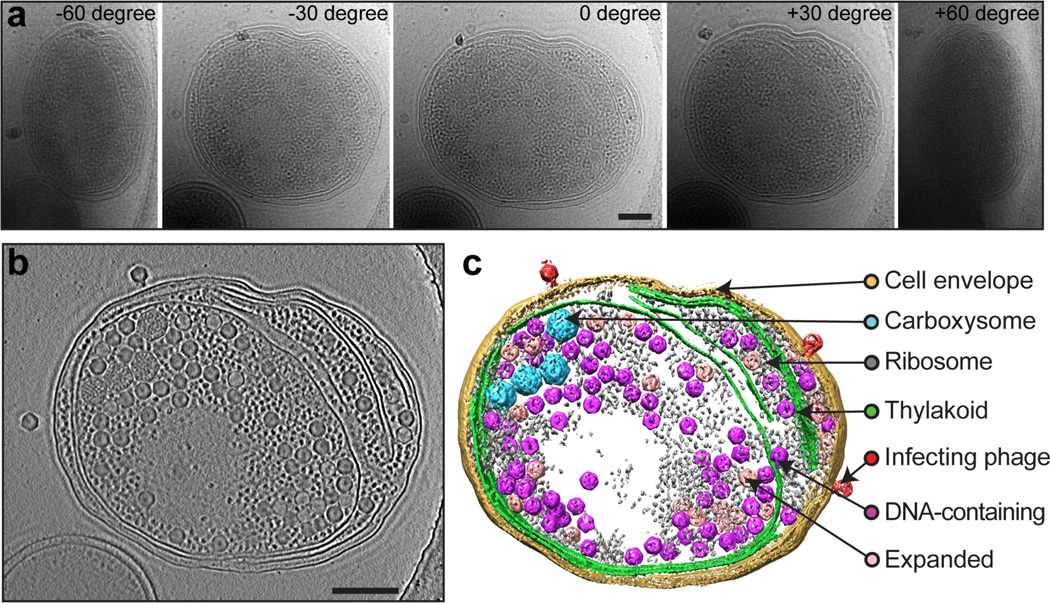
Figure 6. ZPC cryoET of a Syn5-infected WH8109 cell.
(a) A tilt series of a Syn5-infected WH8109 cell. Five of the image frames at –60°, –30°, 0°, 30° and 60° are shown. (b) A 50-nm slab taken from center of the tomogram reconstructed from the tilt series shown in (a). (c) Annotated view of the tomogram. The infecting phage, phage progeny and cellular components are labeled on the right. Scale bars: 250 nm.

