Fig. 4.
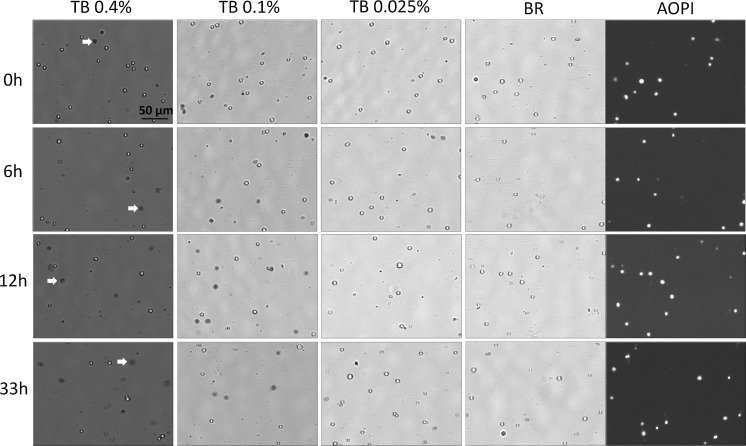
Bright-field and fluorescent images of TB concentration series and AO/PI stained Jurkat cells. a Samples were measured at time points 0, 6, 12, and 33 h post incubation at room temperature. In addition to the increase of large dim diffused shaped cells over time (shown with red arrows), high concentration of TB exhibited more of these cells in comparison to low concentration in the images. (Color figure online)

